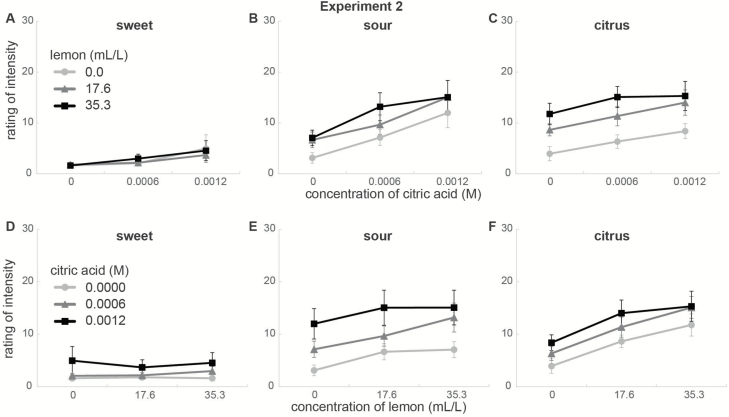
Figure 2.
Mean ratings of sweet intensity (left panels), sour intensity (center panels), and citrus intensity (right panels) in Experiment 2, plotted against both the concentration of citric acid (upper panels) and the concentration of lemon (lower panels). Error bars depict standard errors of the means.

