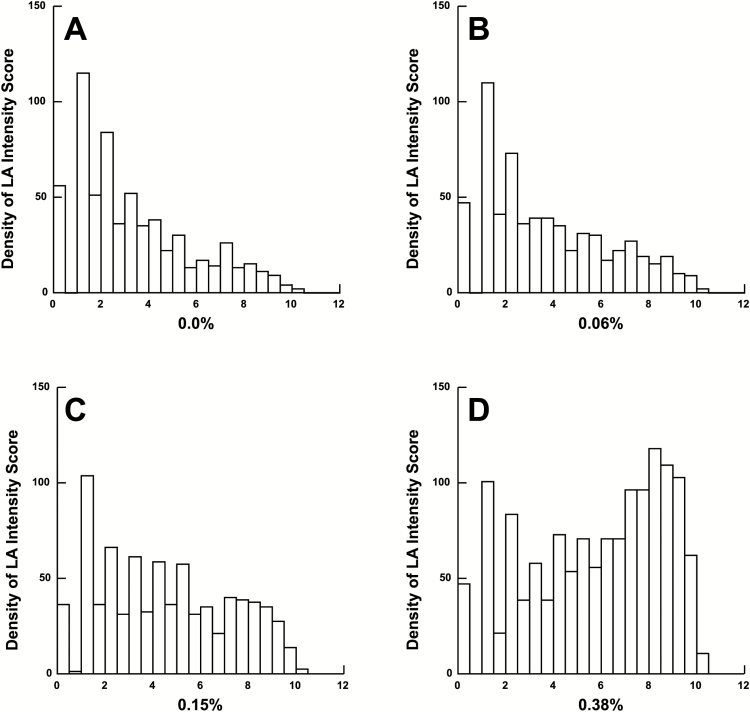
Figure 1.
Histogram of LA intensity scores. Histograms of the raw scores (transformed by square root) for each concentration of LA. The X-axis (range from 0 to 12) represents the square root of the raw taste intensity score at the indicated concentration of LA. The Y-axis plots the number of participants at each intensity score. (A) Control strip (0.0% LA); (B) Low concentration (0.06% LA); (C) Medium concentration (0.15% LA); and (D) High concentration (0.38% LA).

