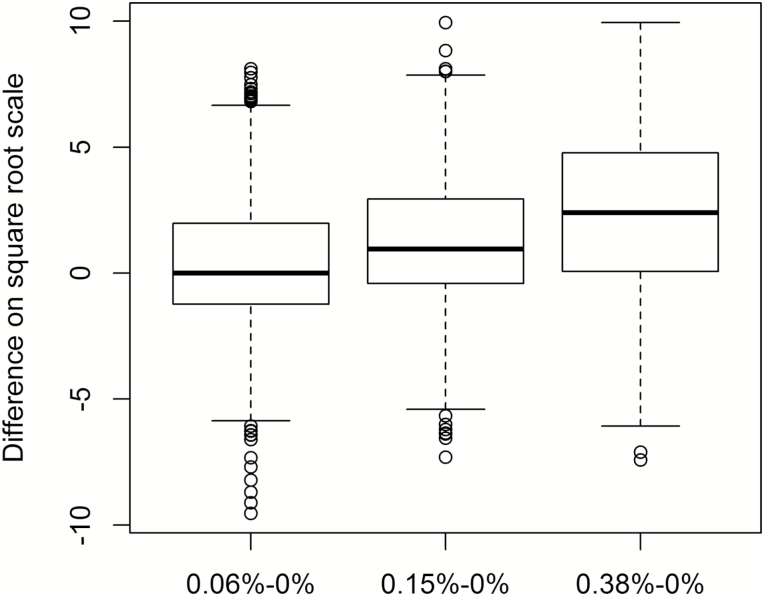
Figure 3.
Significant differences in taste response from baseline. Box and whisker plot of matched data. Box and whisker plot showing quartiles of raw intensity scores (transformed by square root). The median is represented by the middle line within each box with the second quartile the lower segment of the box and the third quartile the upper segment of the box. The whiskers of the plot represent the lower quartile (bottom whisker) and the upper quartile (top whisker). There were significant differences observed between each concentration tested when accounting for baseline response to the control (0.0%LA). Heritability analyses correlate similarity in the response between relatives with the degree of their relationship.

