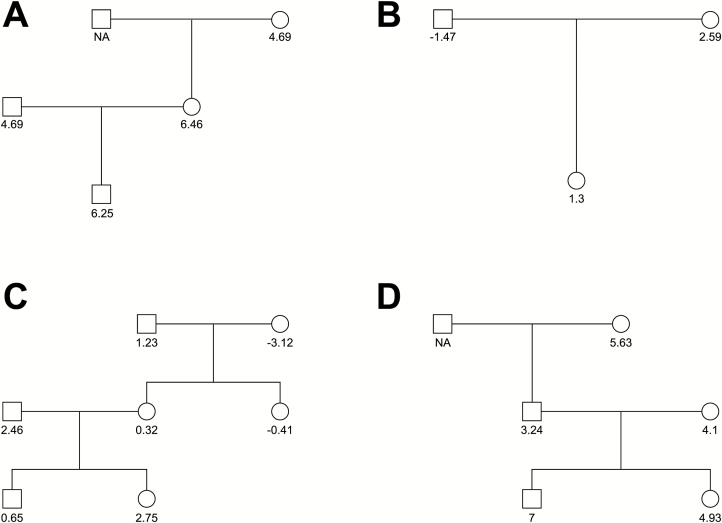
Figure 4.
Example pedigrees. Example pedigrees from the dataset are plotted along with their difference in taste response at LA 0.38% from the baseline level of LA 0%. Squares represent male relatives, circles represent female relatives. The score below each family member represents their difference in their taste score from the high concentration of LA (0.38%) from the control (0.0%) NA indicates the relative was not present for testing.

