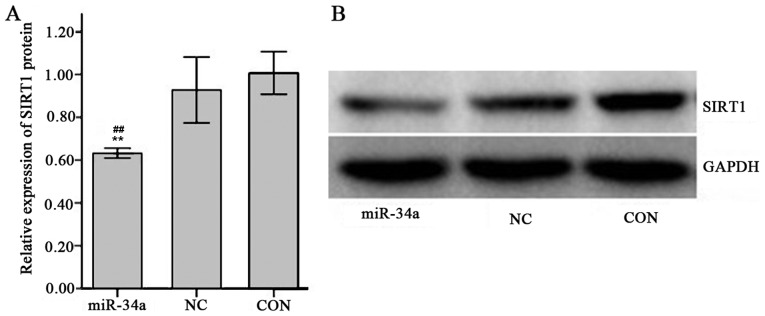
Figure 10.
Relative expression of SIRT1 protein determined by western blot analysis. (A) Quantified western blot results. (B) Images of western blot analysis. The groups were as follows: miR-34a, infected hsa-miR-34a over-expression viral group; CON, uninfected non-viral group; NC, infected negative control viral group. Values are expressed as the mean ± standard deviation for three experiments. **P<0.01 vs. NC group, ##P<0.01 vs. CON group. miR-34a, microRNA-34a; SIRT1, sirtuin 1.

