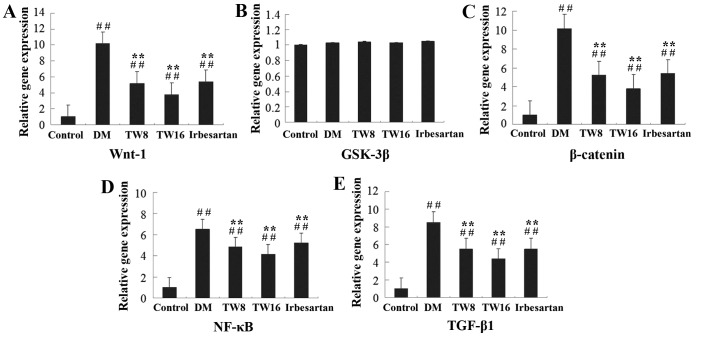
Figure 2.
Relative gene expression of (A) Wnt-1, (B) GSK-3β, (C) β-catenin, (D) NF-κB and (E) TGF-β1 in the kidney tissues of rats from the 5 groups. The relative gene expression levels of Wnt-1, GSK-3β, β-catenin, NF-κB and TGF-β1 mRNA transcripts to control β-actin in individual rats in the Control (n=10), DM (n=10), TW8 (n=10), TW16 (n=11) and Irbesartan (n=10) groups were determined by reverse transcription-quantitative polymerase chain reaction. Data are expressed as the mean ± standard deviation. ##P<0.01 vs. Control group; **P<0.01 vs. DM group. GSK, glycogen synthase kinase; NF, nuclear factor; TGF, transforming growth factor; DM, diabetes mellitus; TW8, 8 mg/kg Tripterygium wilfordii; TW16, 16 mg/kg Tripterygium wilfordii.

