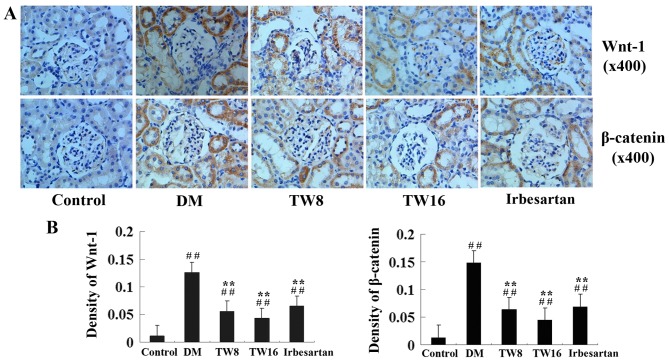
Figure 4.
Immunohistochemical analysis of Wnt-1 and β-catenin expression in the kidney tissues of rats from the Control (n=10), DM (n=10), TW8 (n=10), TW16 (n=11) and Irbesartan (n=10) groups. The expression of Wnt-1 and β-catenin in the kidney tissues of individual rats were determined by (A) immunohistochemistry and (B) quantitatively analyzed. Data are representative images of the kidney tissues of each group of rats (magnification, ×400). ##P<0.01 vs. Control group; **P<0.01 vs. DM group. GSK, glycogen synthase kinase; NF, nuclear factor; TGF, transforming growth factor; DM, diabetes mellitus; TW8, 8 mg/kg Tripterygium wilfordii; TW16, 16 mg/kg Tripterygium wilfordii.

