. 2017 Oct 20;8(12):8443–8450. doi: 10.1039/c7sc03501b

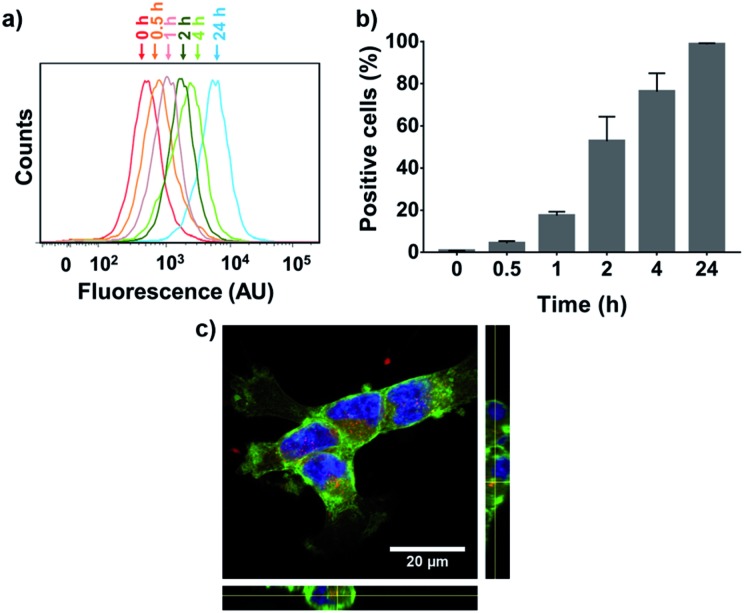
Fig. 5. Cellular internalization of PGC–PTX-Rho NPs. Uptake of PGC–PTX-Rho NPs was measured over time in MSTO-211H cells using flow cytometry. (a) A sample set of histograms shows increased fluorescence intensity of the cell population over time. (b) Positive cells are defined as cells which exhibit higher fluorescence than 99% of the control/untreated population. Data presents mean ± standard deviation of three individual experiments. (c) Laser-scanning confocal microscope image of MSTO-211H cells after 24 hours of incubation with PGC–PTX-Rho NPs. Image presented is the 2-D projection of a 3-D, 6 μm z-stack. Orthogonal views are shown on the periphery. Cell membranes are visualized in green, nuclei in blue, and NPs in red.

Fig. 5