. 2017 Oct 23;8(12):8451–8463. doi: 10.1039/c7sc02801f

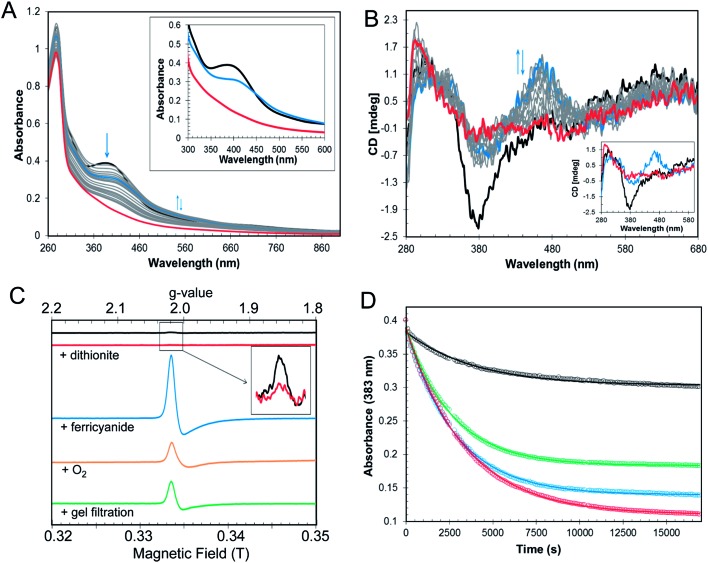
Fig. 3. O2 sensitivity of [4Fe4S] RirA. (A) UV-visible absorption spectra and (B) CD spectra were recorded over several hours following exposure of [4Fe–4S] RirA (30 μM in cluster in buffer B) to 230 μM O2. Inset in (A) are absorbance spectra recorded at 0 min (black), 44 min (blue) and 24 h (1440 min, red). Inset in (B) are CD spectra recorded at 0 min (black), 44 min (blue) and 5.5 h (339 min, red). (C) EPR spectra of [4Fe–4S] RirA (black), and following: addition of 100 μM of sodium dithionite (red); addition of 100 μM of potassium ferricyanide (blue); exposure to O2 (orange); and, gel filtration (green). Inset is an expanded view of the signal in the reconstituted sample before and after addition of dithionite. RirA (100 μM [4Fe–4S] RirA) was in buffer B. (D) Plots of UV-visible absorbance at 383 nm as a function of time following addition of increasing concentrations of O2 to [4Fe–4S] RirA (30 μM in cluster). 58 μM O2 (black), 115 μM O2 (green), 172 μM O2 (blue) and 230 μM O2 (red). Fits to the data are represented by solid lines. Pathlength for all measurements was 1 cm.

Fig. 3