. 2017 Oct 23;8(12):8451–8463. doi: 10.1039/c7sc02801f

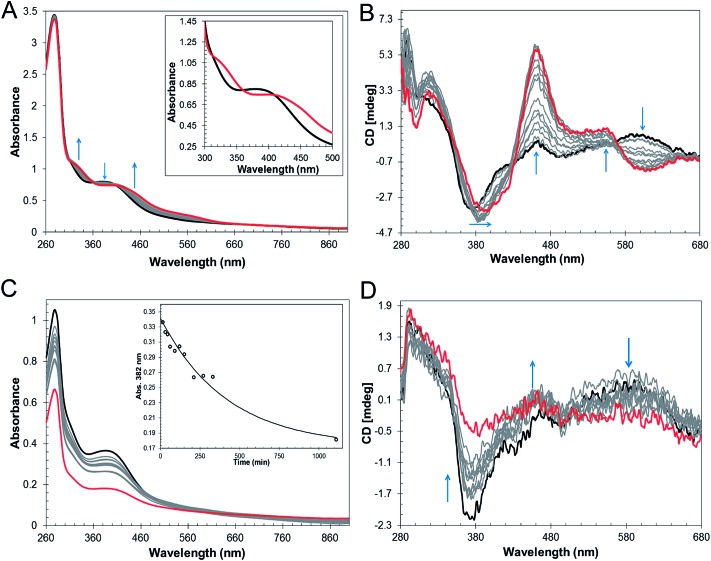
Fig. 4. Response of [4Fe–4S] RirA to low iron conditions. (A) UV-visible absorbance spectra and (B) CD spectra of [4Fe–4S] RirA (77 μM in cluster in buffer B) following addition of increasing concentrations of EDTA (up to 8.2 mM) under anaerobic conditions. Starting and end-point spectra are in black and red, respectively. Inset in (A) are absorbance spectra in the absence of EDTA (black) and with 8.2 mM EDTA (red). (C) and (D) as in (A) and (B), except that Chelex-100, separated from the protein by dialysis membrane, was the iron chelator. Inset in (C) is a plot of A382 nm as a function of time; the solid line represents a fit of the data (k = 2.4 ± 0.6 × 10⁻³ min–1). In (B) and (D), arrows show the most significant changes in spectral features during the titration. Pathlength was 1 cm for all measurements.

Fig. 4