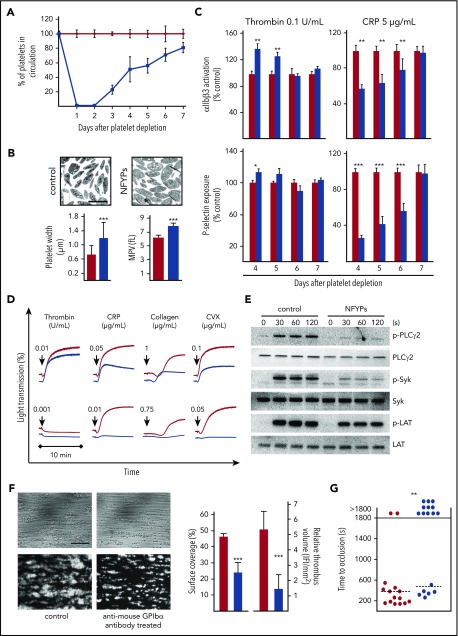
Figure 1.
NFYPs after anti-mouse GPIbα antibody–induced thrombocytopenia display impaired GPVI signaling. (A) Male NMRI mice were injected with 4 µg/g of anti-mouse GPIbα antibodies, platelet count was determined by flow cytometry. Data points are represented as percent values ± SD compared with vehicle-treated controls (phosphate-buffered saline injected) (100%) at the indicated time points after depletion. The red line represents vehicle-treated mice, and the blue line represents anti-mouse GPIbα antibody–treated mice. (B) Representative transmission electron microscopy images of resting control platelets and NFYPs. Scale bar, 2.5 μm. Platelet width was determined by analyzing electron microscopy images. Mean platelet volume (MPV) on day 5 after platelet depletion was measured with an automated blood cell analyzer (Sysmex). The red bar represents vehicle-treated control mice, and the blue bar represents anti-mouse GPIbα antibody–treated mice. (C) Integrin αIIbβ3 activation and P-selectin exposure as measure of α-granule release of control platelets (red bar) and NFYPs (blue bar) in response to thrombin (0.1 U/mL) and CRP (5 µg/mL) on the indicated days after platelet depletion by anti-mouse GPIbα antibodies. Results are represented as percent activation with respect to control set at 100%. Results are depicted as mean fluorescence intensities ± SD of 5 mice per group and are representative of 4 individual experiments. *P < .05, **P < .01, and ***P < .001. (D) Platelets isolated from vehicle-treated controls (red line) or anti-GPIbα-antibody–treated mice (blue line) on day 5 after depletion were stimulated with the indicated agonists, and light transmission was recorded on a Fibrintimer 4-channel aggregometer. (E) Determination of whole-cell tyrosine phosphorylation pattern. Platelets were isolated on day 5 after depletion and stimulated with 0.1 μg/mL CRP under stirring conditions at 37°C, and aliquots were taken at the indicated time points. Samples were probed with anti-phospho-specific antibodies against PLCγ2 (Y759), Syk (Y519/520), and LAT (Y191). The membranes were stripped and reprobed for the total protein expression. (F) Heparinized whole blood from vehicle-treated mice (red) or anti-GPIbα antibody–treated mice (blue) on day 5 after depletion was perfused over immobilized collagen (0.2 mg/mL) at a shear rate of 1000 s−1. Blood from antibody-treated mice was reconstituted with isolated blood cells from other antibody-treated mice to replenish normal platelet counts. Representative phase contrast and fluorescent images (anti-GPIX-DyLight488) are shown. Data represent mean surface coverage and relative thrombus volume ± SD (n = 8 per group; scale bar, 50 μm). ***P < .001. (G) The abdominal aorta of vehicle-treated (red) and anti-GPIbα antibody–treated (blue) mice day 5 after depletion was injured by tight compression with a forceps, and blood flow was monitored for 30 minutes with an ultrasonic flow probe. The time to stable vessel occlusion is shown. Each symbol represents 1 individual mouse. **P < .01.

