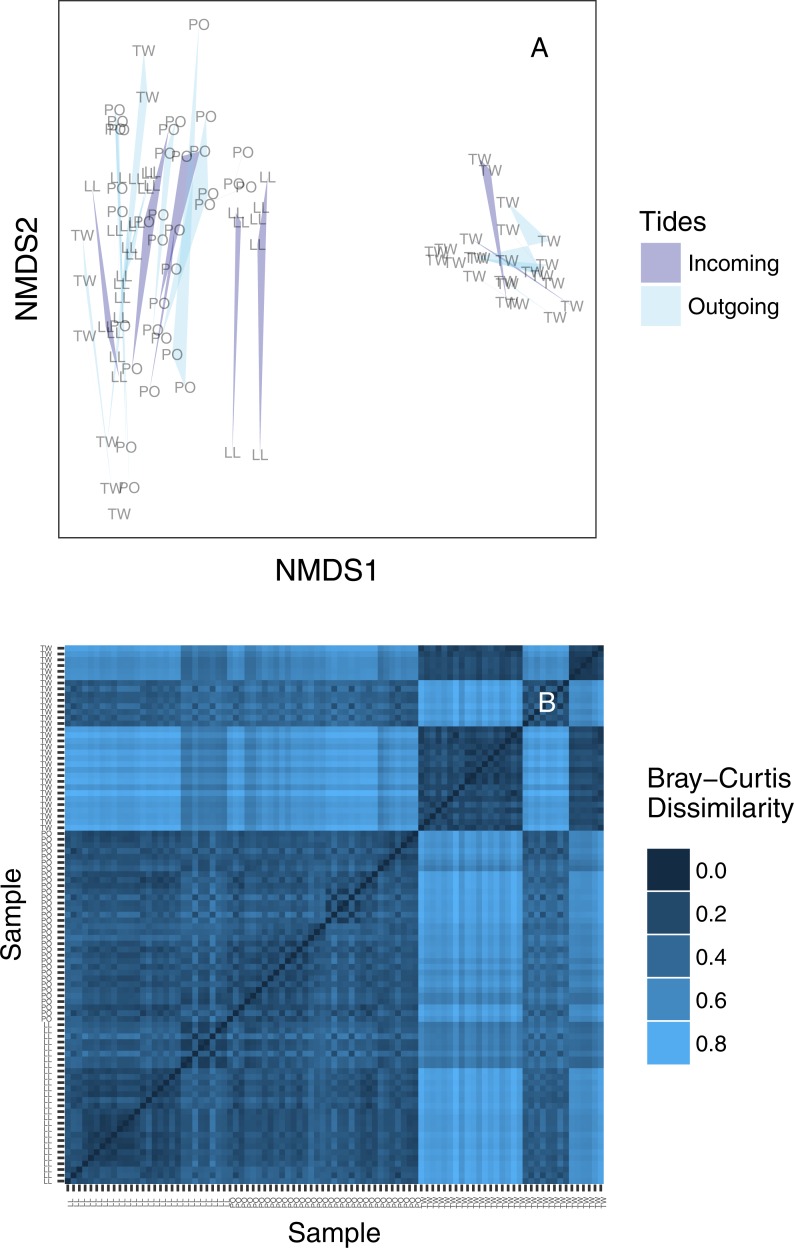
Figure 4. (A) Ordination plot (non-metric multidimensional scaling; NMDS) plot of Bray–Curtis dissimilarities among sequenced replicates, by sampling bottle (polygon) and tide (polygon color). Polygons connect communities sequenced from replicate PCR reactions of the same sampled bottle of water. (B) The same data shown as a heatmap, ordered by site identity. Only the Twanoh samples (upper right) stand out as having substantial heterogeneity, reflecting the two different communities present during different sampling events at that site.
Site labels: TW, Twanoh; PO, Potlatch; LL, Lilliwaup.

