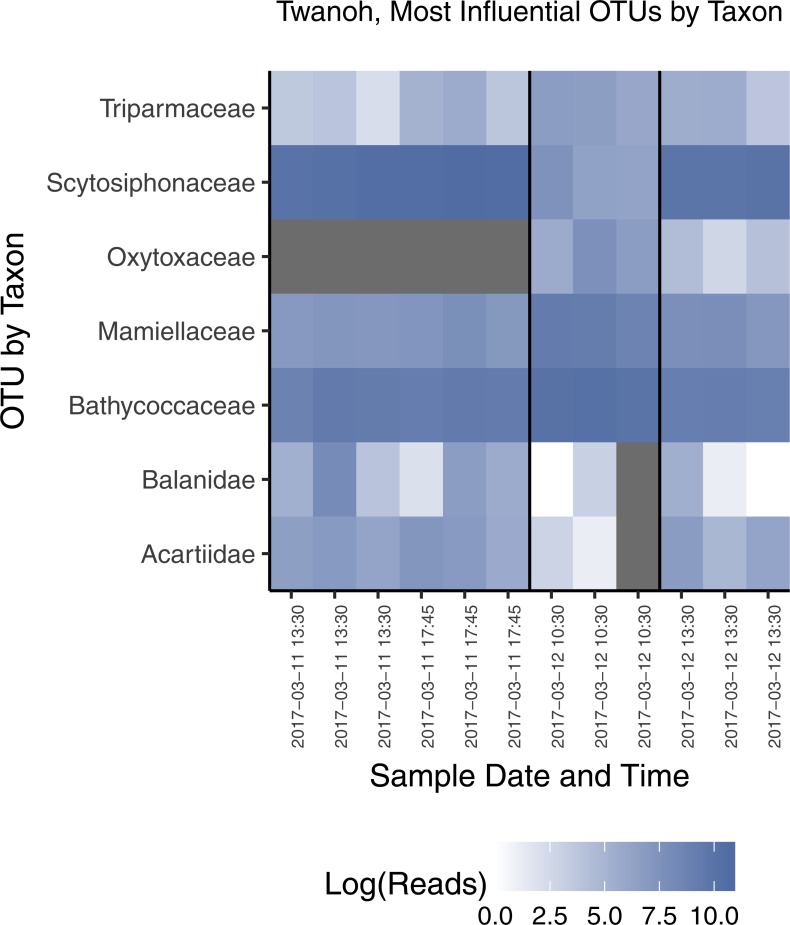
Figure 7. Most influential OTUs, plotted by taxonomic Family, distinguishing the two ecological communities observed in water samples from Twanoh State Park.
Shown are the taxonomic Families of OTUs with at least 1,000 reads in the rarefied dataset, and having a constrained canonical correspondence analysis (CCA) score of greater than 0.7 (absolute value), which in our dataset most clearly divides the two communities. See text for CCA details. The vertical black lines in the chart delineate the communities identified previously by NMDS (see Fig. 3A), with the time of each sample given along the x-axis, showing the shift from one community to the other—and then largely back again—within less than 24 h. Note that each block of samples reflects a different point in the tidal cycle, and that the first two time points indicate a continuity of community membership despite a change in tide (see Fig. 4).

