
Fig. 2. FBXL19 dampens the LPS-stimulated increase in CBP protein abundance.
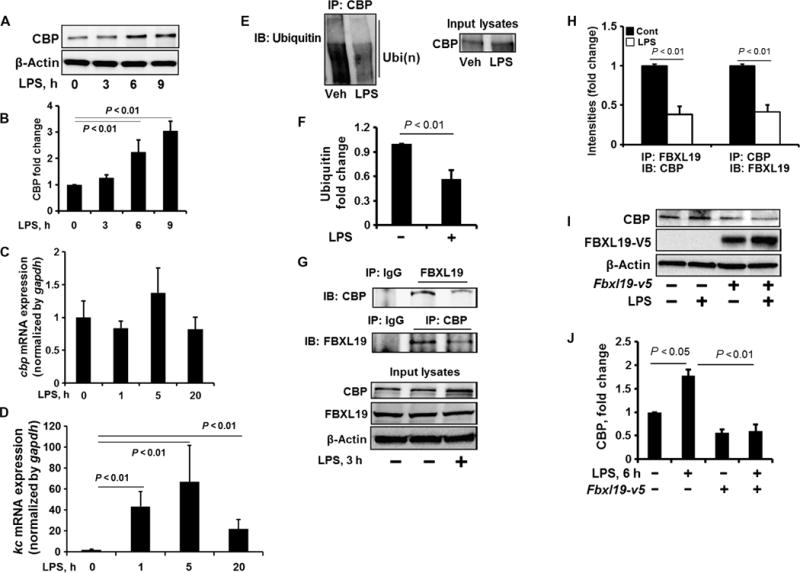
(A and B) MLE12 cells were treated with LPS (10 μg/ml) for 0, 3, 6, and 9 hours. (A) Cell lysates were analyzed by Western blotting with antibodies against the indicated proteins. (B) Determination of relative CBP protein abundance by densitometric analysis of Western blots with ImageJ software. Data are means ± SEM of three independent experiments. P values were calculated by one-way ANOVA and post hoc Tukey’s test. (C and D) MLE12 cells were treated with LPS (10 μg/ml) for 1, 5, or 20 hours. Total RNAs were extracted and cbp (C) and kc (D) mRNA abundances were measured by reverse transcription polymerase chain reaction (RT-PCR). Data are means ± SEM of three independent experiments. P values were calculated by one-way ANOVA and post hoc Tukey’s test. gapdh, glyceraldehyde-3-phosphate dehydrogenase. (E and F) MLE12 cells were treated with LPS (10 μg/ml, 3 hours). (E) Cell lysates were subjected to immunoprecipitation with an anti-CBP antibody and Western blotting with an anti-ubiquitin antibody. Input lysates were analyzed by Western blotting with an anti-CBP antibody. (F) The relative amounts of ubiquitylated CBP were determined by densitometric analysis. Data are means ± SEM of three independent experiments. P values were calculated by unpaired Student t test. (G and H) MLE12 cells were treated with LPS (10 μg/ml, 3 hours). (G) Cell lysates were subjected to immunoprecipitation with immunoglobulin G (IgG) or with antibody against FBXL19 or CBP, followed by Western blotting with antibodies against CBP and FBXL19. (H) The relative amounts of CBP and FBXL19 were determined by densitometric analysis. Data are means ± SEM of three independent experiments. P values were calculated by unpaired Student t test. (I and J) MLE12 cells were transfected with the Fbxl19-v5 plasmid. Forty-eight hours later, the cells were treated with LPS (10 μg/ml, 6 hours). (I) Cell lysates were analyzed by Western blotting with antibodies against the indicated proteins. (J) Determination of relative protein abundance by densitometric analysis of Western blots with ImageJ software. (J) Data are means ± SEM of three independent experiments. P values were determined by one-way ANOVA and post hoc Tukey’s test. All Western blots are representative of at least three independent experiments.