
Fig. 8. Inhibition of USP14 reduces cytokine release in vitro and in vivo.
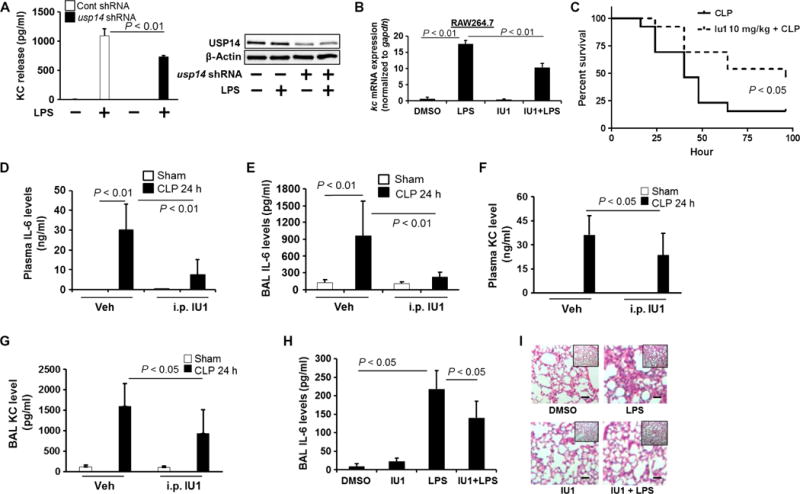
(A) MLE12 cells were transfected with Cont shRNA or usp14 shRNA before they were treated with LPS (10 μg/ml) for 6 hours. KC release was measured by ELISA. Data are means ± SEM of three independent experiments. P values were calculated by two-way ANOVA and post hoc Tukey’s test. Cell lysates were analyzed by Western blotting with antibodies against USP14 and β-actin. (B) Raw264.7 cells were treated with IU1 (50 μM) for 16 hours before they were treated with LPS (200 ng/ml) for 3 hours. The relative abundance of kc mRNA was analyzed by real-time PCR. Data are means ± SEM of three independent experiments. P values were calculated by two-way ANOVA and post hoc Tukey’s test. (C) C57/BL6 mice were subjected to CLP, which was followed by intraperitoneal injection of IU1 (10 mg/kg body weight). Survival rates were determined for up to 100 hours (n = 13 mice per group), and P values were calculated by Mantel-Cox log-rank test. (D to G) C57/BL6 mice were subjected to CLP, which was followed by intraperitoneal (i.p.) injection of IU1 (10 mg/kg body weight). Twenty-four hours later, the concentrations of plasma IL-6 (D), BAL IL-6 (E), plasma KC (F), and BAL KC (G) were analyzed by ELISA. Data are means ± SEM of five to seven samples per group. P values were calculated by two-way ANOVA and post hoc Tukey’s test. (H) C57/BL6 mice were subjected to intratracheal injection of LPS (5 mg/kg body weight), followed by intratracheal injection of IU1 (10 mg/kg body weight). Twenty-four hours later, the concentration of IL-6 in the BAL was measured by ELISA. Data are means ± SEM of six to eight samples per group. P values were calculated by two-way ANOVA and post hoc Tukey’s test. (I) Lung tissues from the experiments depicted in (H) were stained with hematoxylin and eosin. Scale bars, 20 μm. Images are representative of lung tissues from six to eight mice.