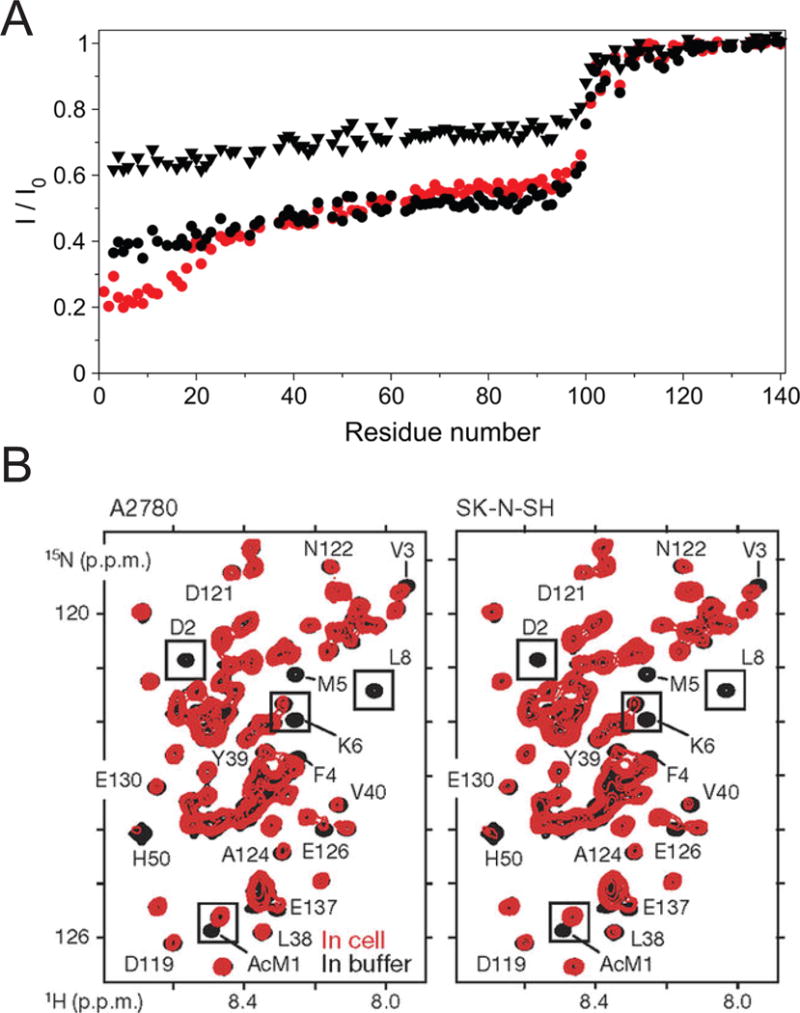
Figure 8.

Solution NMR of α-synuclein. (A) Ratios of wild-type α-synuclein TROSY-HSQC peak heights in the presence (I) and absence (Io) of lipid bilayer vesicles. Data from the following three samples are presented: N-terminally acetylated α-synuclein at a lipid:protein (L:P) ratio of 22 (red circles), nonacetylated α-synuclein at an L:P ratio of 22 (black triangles), and nonacetylated α-synuclein at an L:P ratio of 44 (black circles). Reproduced with permission from reference [75]. (B) In-cell HSQC NMR spectra of α-synuclein in A2780 and SK-N-SH cells (red) and of isolated N-terminally acetylated α-synuclein in buffer (black). AcM1, acetylated Met1. Reproduced with permission from reference [81].
