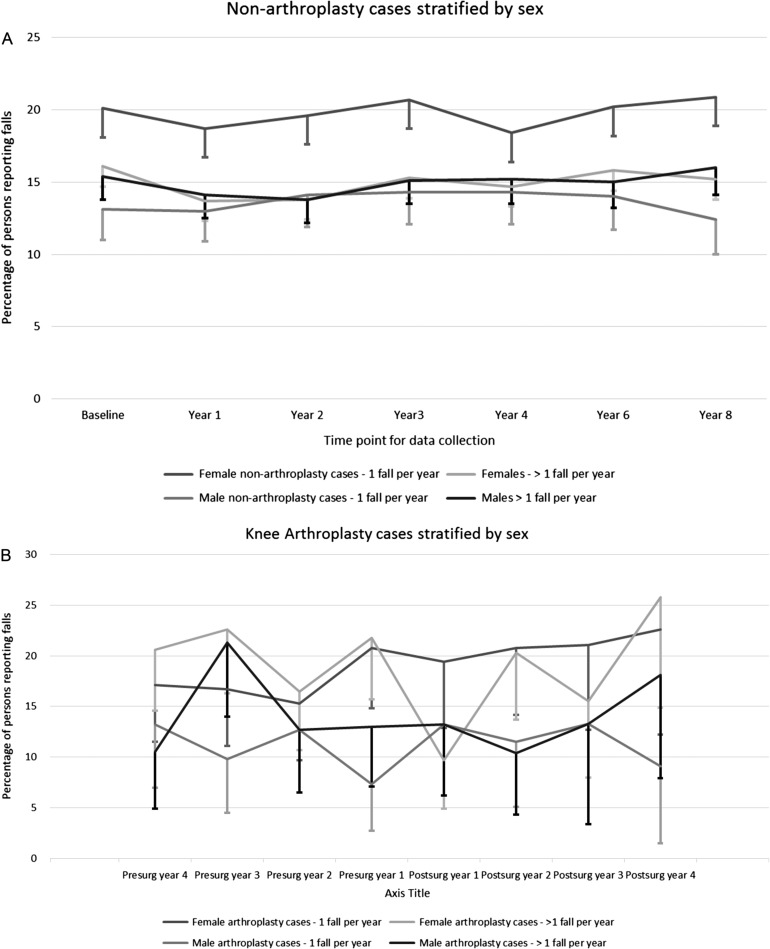
Figure 1.
(A) Yearly prevalence of one-time and multiple fall rates over an 8-year period for persons in the non-arthroplasty group. Error bars represent lower bounds of 95% confidence intervals. (B) Yearly prevalence of one-time and multiple fall rates over an 8-year perioperative period for persons in the arthroplasty group. Error bars represent lower bounds of 95% confidence intervals.

