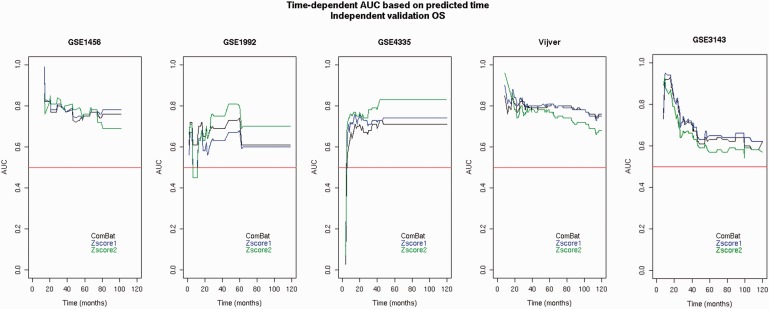
Figure 3.
Time-dependent AUC based on different predicted time points generated from the merged data sets with respect to the OS endpoint assessed by independent validation.Four data sets (among GSE1456, GSE1992, GSE4335, Vijver and GSE3143) were used for the training set. The data sets composing the training set were merged and adjusted by Z -score1 normalization ( Z -score1 for short), Z -score2 normalization ( Z -score2 for short) or ComBat and then validated on the remaining set (testing set). The testing set is indicated at the top of each plot. Random prediction (AUC = 0.50) is illustrated by the diagonal red line.

