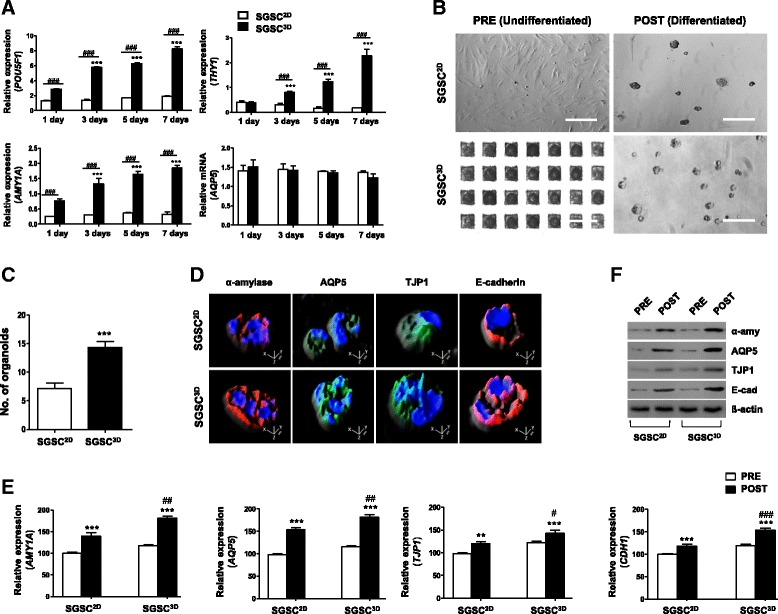
Fig. 1.

Enhanced differentiation potential of 3D-assembled SGSC spheroids. a Transcription levels of salivary acinar (AMY1A and AQP5) and stem cell-related (POU5F1 and THY1) markers compared by qPCR at 1, 3, 5, and 7 days between 2D monolayer-cultured SGSCs (SGSCs2D) and 3D spheroid-derived SGSCs (SGSCs3D) culture. Data from three independent experiments analyzed and presented as mean ± SEM (n = 3). Two-way ANOVA, Bonferroni’s post hoc test. *Compared with Day 1; #compared with SGSCs2D in each group. b Light microscope images of SGSCs after differentiation. Scale bars represent 400 μm. c Differentiation capacity determined by measuring average number of acinus-like organoids per plate after plating same number of cells. Data from five independent experiments analyzed and presented as mean ± SEM (n = 5). One-way ANOVA; Tukey’s post hoc test. *Compared with monolayer-cultured salivary gland-resident stem cells (SGSCs2D). d Immunofluorescent images representing salivary acinar markers α-amylase (red) and AQP5 (green), tight junction protein TJP1 (green), and adherence protein E-cadherin (red). Scale bars represent 20 μm. e mRNA levels of SG acinar cell markers (AMY1A and AQP5), tight junction gene (TJP1), and intercellular adherence gene (CDH1) determined by real-time PCR in SGSC2D and SGSC3D cultures after differentiation. All qPCR measurements performed in triplicate. f Protein levels of α-amylase, AQP5, TJP1, and E-cadherin determined by western blotting in SGSC2D and SGSC3D cultures after differentiation. **P < 0.01, ***P < 0.001, #P < 0.05, ##P < 0.01, ###P < 0.001. SGSC salivary gland-resident stem cell
