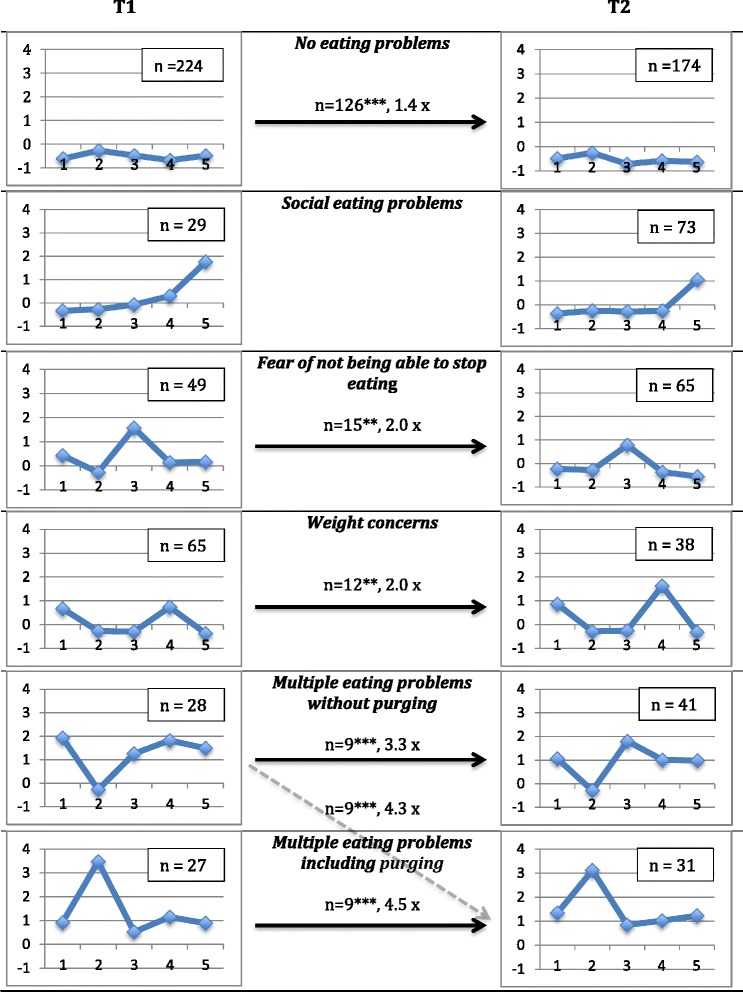
Fig. 1.

Cluster profiles at T1 and T2 in terms of z-scores. Full arrows indicate significant developmental (individual) stability. When no arrow is depicted it means that there was no individual stability. The figure also shows the strength of this stability; for example, there were 1.4 times as many girls as expected by chance who belonged to the No eating problems cluster at T1 and stayed in the same cluster at T2. The dotted arrow indicates a significant change. 1 = “I diet”; 2 = “I throw up to get rid of food that I have eaten”; 3 = “I’m afraid of not being able to stop eating once I’ve started”; 4 = “I feel that my desire to lose weight has completely taken over”; 5 = “I feel uncomfortable when I eat with others”. *p < .05; **p < .01; ***p < .001
