Fig. 7.

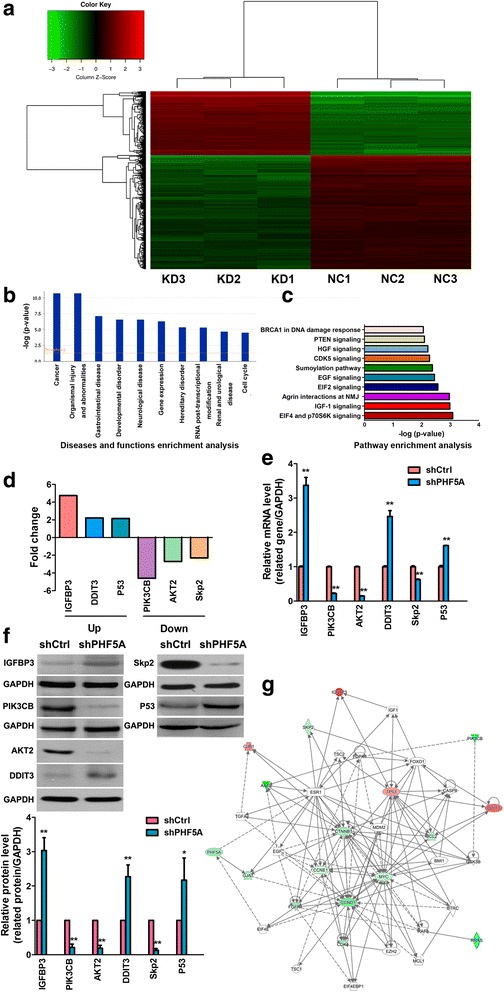
Microarray analysis of H1299 cells after PHF5A knockdown. a Hierarchical cluster analysis of shCtrl and shPHF5A-transfected H1299 cells. A total of 1112 genes were differentially expressed. Heat-map colors represent mean-centered fold change expression in log-scale. b Disease and function enrichment analysis based on gene numbers, expression levels, and significance probability suggested that among the retrieved categories, genes related to “Cancer” ranked first with the greatest changes. c Pathway enrichment analysis for related genes, based on significance probability, suggested that among the analyzed gene sets, genes related to the IGF-1 signaling pathway ranked second in showing the greatest changes in expression levels. d Fold changes of three putative IGF-1 pathway genes, including IGFBP3, PIK3CB, and AKT2, as well as cell cycle/apoptosis related genes, including DDIT3, Skp2, and P53, based on microarray analysis. e-f Validation of microarray data by qRT-PCR (e) and Western blot (f). IGFBP3, DDIT3, P53 were significantly up-regulated, while PIK3CB, AKT2, and Skp2 were significantly down-regulated upon PHF5A knockdown. g Knowledge-based interactive network for the selected targets in the IGF-1 pathway as well as cell cycle/apoptosis related molecules was constructed with the Reactome database. Red and green denote up-regulated and down-regulated genes, respectively. NMJ, neuromuscular junction (c). *P < 0.05; **P < 0.01, compared with the shCtrl group. A higher quality of Fig. 7 is available as Additional file 6
