Fig. 7.

Intercomparison of gene expression values derived from RNA-seq and qRT-PCR. Foldchange was calculated from 11 DEGs, and a high correlation (R2 = 0.89) was obtained between them

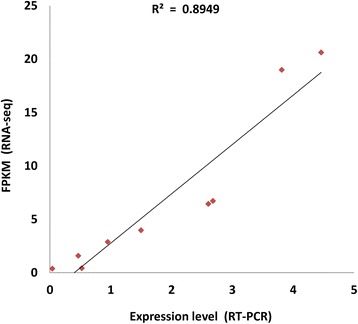
Intercomparison of gene expression values derived from RNA-seq and qRT-PCR. Foldchange was calculated from 11 DEGs, and a high correlation (R2 = 0.89) was obtained between them