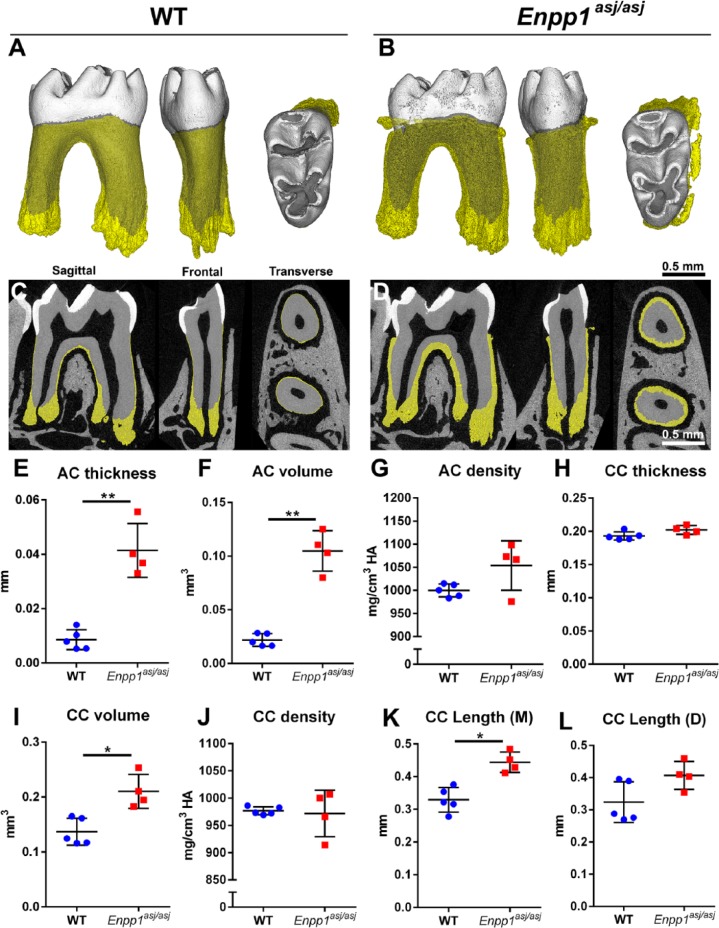
Figure 5.
Enpp1 mutant mice feature increased acellular and cellular cementum dimensions. High-resolution micro–computed tomography analysis reveals hypercementosis in Enpp1asj/asj versus wild-type (WT) mouse first mandibular molars (n = 4 to 5) in (A, B) 3-dimensional reconstructions and (C, D) 2-dimensional cut planes in sagittal, frontal, and transverse orientations. Cementum layer is highlighted in yellow. Quantitative analysis of molars shows significantly increased (E) acellular cementum (AC) thickness (**adjusted P = 0.002) and (F) volume (**adjusted P = 0.002), and (G) a nonsignificant increase in mean AC density in Enpp1asj/asj versus WT mice. (H–L) Significant increases are observed in cellular cementum (CC) volume (*adjusted P = 0.02) and length on mesial (M) root (*adjusted P = 0.01), although differences are not found in thickness, density, or distal (D) root CC length (adjusted P > 0.05 for all). For independent samples t test, calculated P values were adjusted and statistical significance determined by the Benjamini-Hochberg procedure for Q = 0.05.

