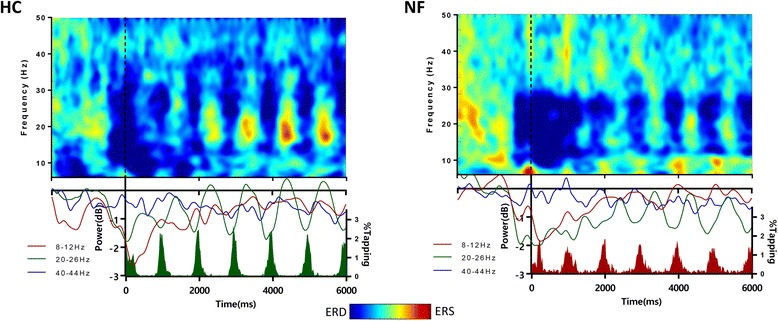
Fig. 4.

Time-frequency plots of the control and NF1 groups during synchronous finger tapping at 1 Hz. A similarly strong periodical variation in the beta band is conspicuous in both groups and at the ideal motor tapping frequency in the beta sub-band of 20–26 Hz, centred in the desynchronization beta peak (23 ± 3 Hz) and with a modulation matching behaviour. Note that the colour peaks just reflect maxima and minima positions, and it is the difference that needs to be considered for statistical analysis
