Fig. 5.

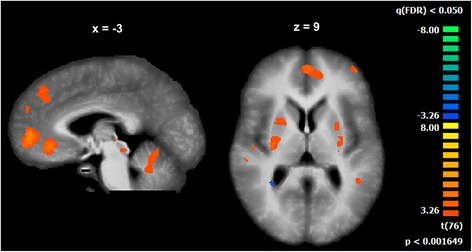
Significant differences between the control group and the NF1 group (t(76) > 3.26, p < 0.05, FDR corrected for multiple comparisons, minimum cluster size of 20 voxels) during performance matched conditions (5 Hz synchronous and alternate)

Significant differences between the control group and the NF1 group (t(76) > 3.26, p < 0.05, FDR corrected for multiple comparisons, minimum cluster size of 20 voxels) during performance matched conditions (5 Hz synchronous and alternate)