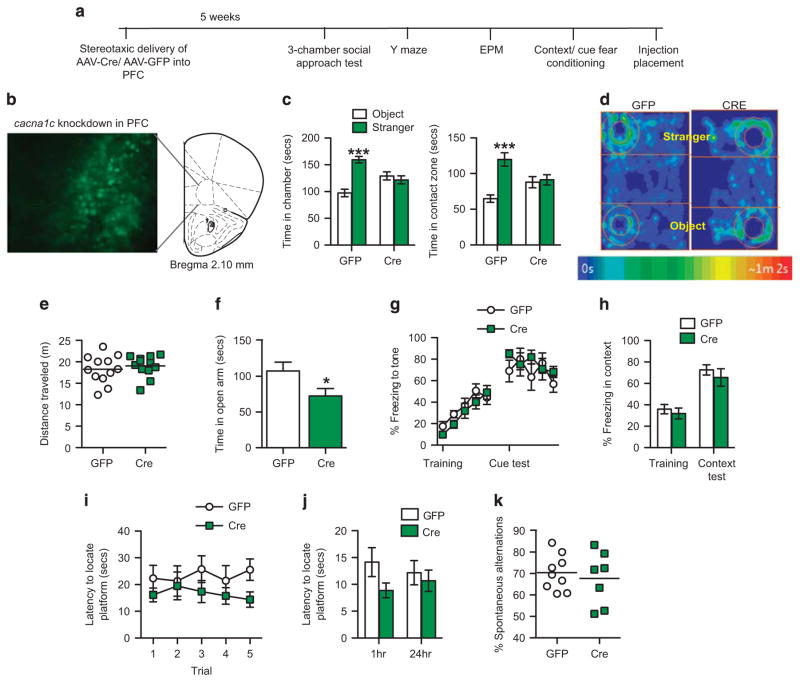
Figure 2.
Focal knockdown of cacna1c in the adult PFC recapitulates the social deficit and elevated anxiety-like behavior. (a) Outline of experimental design. AAV-Cre or AAV-GFP was stereotaxically injected into the PFC of adult cacna1c floxed mice and 5 weeks later tested in a battery of behavioral tests. (b) Representative image of GFP-positive cells expressed by AAV-Cre-GFP in the PFC of cacna1c floxed mice. (c) In the three-chamber social approach test, GFP but not Cre mice spent significantly more time in the chamber (left; Two-way ANOVA, genotype × chamber, F1,44 = 24.28, P <0.0001) and contact zone (right; two-way ANOVA, genotype × zone, F1,44 = 11.71, P = 0.0014) containing the stranger mouse and novel object (Bonferroni post hoc test, ***P<0.001 vs WT; GFP n = 12, Cre n =12). (d) Representative heat maps showing time spent in the chambers and contact zones containing the stranger mouse and novel object during the social approach test. (e) GFP and Cre mice traveled similar distances during the social approach test (GFP n =12, Cre n =12). (f) Cre mice spent significantly less time in the open arm of the elevated plus maze compared to GFP mice (Student’s t-test, t(13) = 2.156, P = 0.05; *P = 0.05 vs GFP; GFP n = 8, Cre n = 7). (g) In cue fear conditioning, GFP and Cre mice displayed similar percent freezing to the tone during training (two-way ANOVA, main effect of tone, F4, 70 = 12.7, P <0.0001) and the test. Each data point represents freezing during a single tone presentation (GFP n = 8, Cre n = 8). (h) In contextual fear conditioning, GFP and Cre mice displayed similar percent freezing to the context during training and the test (GFP n =8, Cre n = 8). (i) In the Y-maze, during training, Cre mice displayed slightly lower latency (main effect of treatment, F1,75 = 5.374, P = 0.0232) in locating the submerged platform compared to GFP mice (GFP n =9, Cre n =8). (j) In the Y-maze memory tests, GFP and Cre mice displayed similar latencies in locating the submerged platform at 1 h and 24 h post-training (GFP n =9, Cre n =8). (k) GFP and Cre mice exhibit similar percent of spontaneous alternations during the working memory Y-maze task (GFP n =8, Cre n =8). Error bars represent mean ± s.e.m. ANOVA, analysis of variance; GFP, green fluorescent protein; PFC, prefrontal cortex.

