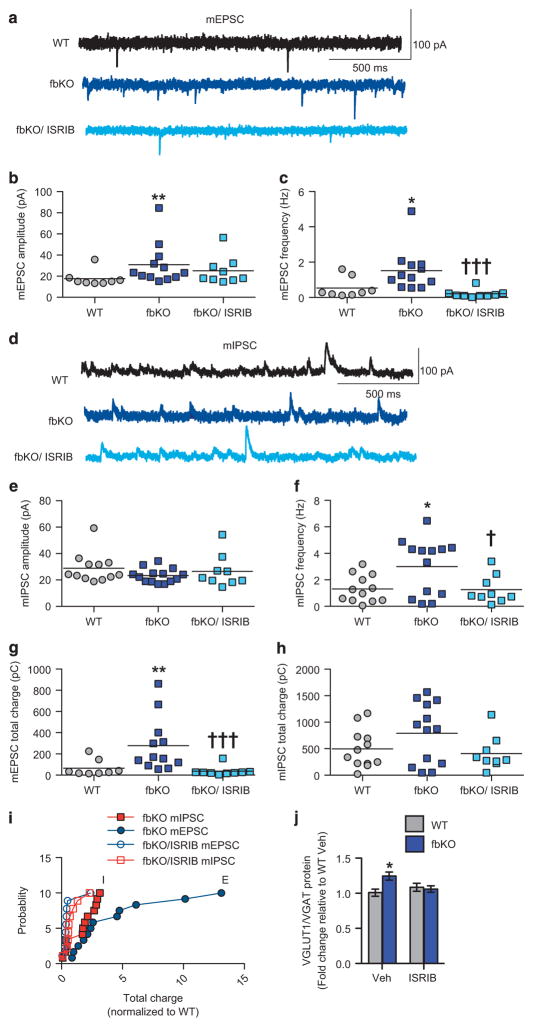
Figure 5.
Cacna1c fbKO mice exhibit higher excitatory/inhibitory ratio in layer 5 pyramidal neurons of the PFC that is normalized with ISRIB. (a) Representative traces of mEPSCs from layer 5 pyramidal neurons of the PFC. (b) fbKO mice displayed significantly higher amplitude of mEPSCs that remained unchanged with ISRIB (Kruskal–Wallis test, H =8.242, P =0.0162; Dunn’s uncorrected post hoc test, **P<0.01 vs WT; WT n =8, fbKO n =12, fbKO/ISRIB n =9 cells, from n =2–4 mice per group). (c) fbKO mice displayed significantly higher frequency of mEPSCs that was normalized to WT levels with ISRIB (Kruskal–Wallis test, H =16.74, P =0.0002; Dunn’s uncorrected post hoc test, *P<0.05 vs WT, †††P<0.0001 vs fbKO; WT n =8, fbKO n =12 cells, fbKO/ISRIB n =9 cells, from n =2–4 mice per group). (d) Representative traces of mIPSCs from layer 5 pyramidal neurons of the PFC. (e) fbKO mice displayed similar amplitude of mIPSCs compared to WT mice that was unchanged with ISRIB (WT n =12, fbKO n =13, fbKO/ISRIB n =9 cells, from n =2–4 mice per group). (f) fbKO mice displayed significantly higher frequency of mIPSCs that was normalized to WT levels with ISRIB (one-way ANOVA, F2, 33 = 4.909, P = 0.0141; Bonferroni post hoc test, *P <0.05 vs WT, †P<0.05 vs fbKO; WT n =12, fbKO n =13, fbKO/ISRIB n =9 cells, from n =4 mice per group). (g) fbKO mice displayed significantly higher total charge transfer for mEPSCs that was normalized with ISRIB (Kruskal–Wallis test, H =14.2, P =0.0008; Dunn’s uncorrected post hoc test, **P<0.01 vs WT, †††P<0.001 vs fbKO; WT n =8, fbKO n = 12, fbKO/ISRIB n =9 cells, from n =2–4 mice per group). (h) fbKO mice displayed similar total charge transfer for mIPSCs compared to WT mice that was unchanged with ISRIB (WT n =12, fbKO n =13, fbKO/ISRIB n =9 cells, from n = 2–4 mice per group). (i) Higher relative change in mEPSC than mIPSC total charge transfer for each fbKO neuron normalized to the mean WT value that was corrected by ISRIB. (j) Compared to WT/Veh mice, fbKO/Veh mice had significantly higher levels of VGLUT1/VGAT ratio in the synaptoneurosome from the PFC while fbKO/ISRIB mice showed normalization of this elevated ratio (two-way ANOVA, treatment × genotype, F1, 23 = 5.797, P = 0.0245; Bonferroni post hoc test, *P <0.05 vs WT; WT: Veh n = 6, ISRIB n = 7; fbKO: Veh n = 6, ISRIB n = 7). Error bars represent mean ±s.e.m. ANOVA, analysis of variance; E, excitatory; fbKO, forebrain knockout, I, inhibitory; mEPSCs, miniature excitatory post synaptic currents; mIPSCs, miniature inhibitory post synaptic currents; WT, wild type.

