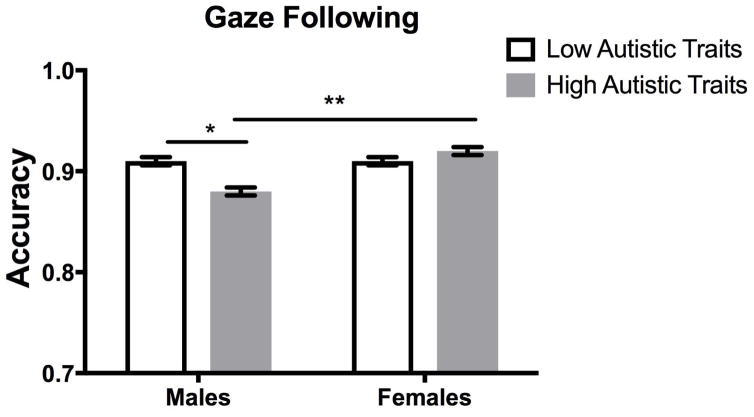
Figure 1.
Average group performance on the eye gaze following task. Data are plotted as the mean (± 1 SEM) accuracy for males and females in the high and low autistic-like trait groups. Analyses revealed a significant difference between males in the high and low autistic trait groups (*p < .005) and between males and females in the high autistic trait groups (**p < .001).

