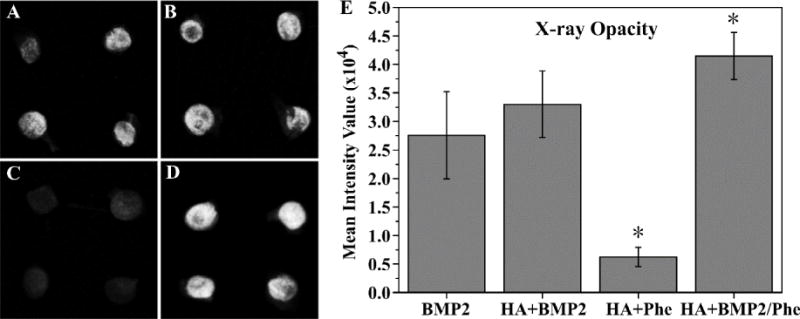
Fig. 7.

Radiographic examination of ossicles (A–D) after harvesting from mice after 4 weeks. BMP2 only group (A), BMP2 + HA group (B), phenamil + HA group (C), and BMP2/phenamil + HA group (D) were all imaged, and mean intensity value of scaffolds was quantified (E). Data are expressed as mean ± SD (n = 4).
