Figure 6.
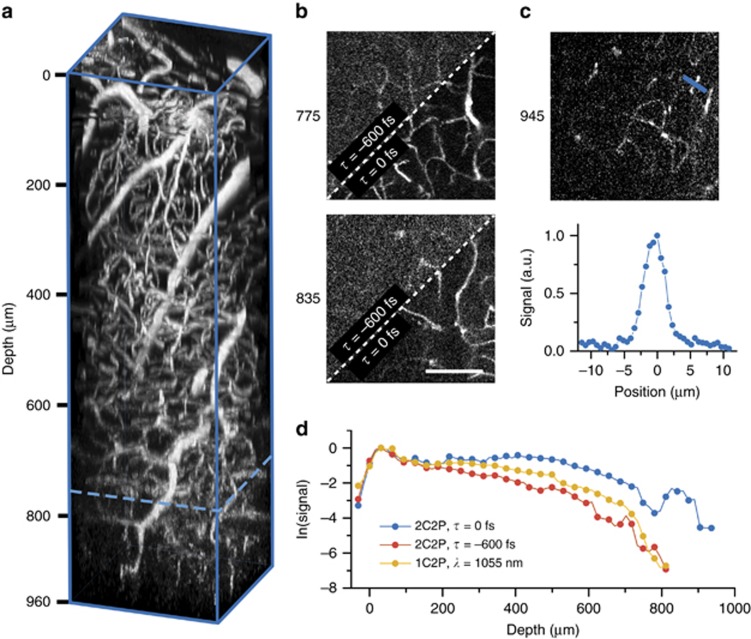
Deep in vivo microscopy with two-color excitation (a) Three dimensional reconstruction of a vascular images taken with two-color two-photon excitation (λ1=1055 nm, λ2=1240 nm) in the brain of an adult mouse. The field of view is 300 μm and the stack depth is 960 μm. The dotted blue line is the approximate depth limit of 1C2P (λ=1055 nm). (b) 2D plane maximum intensity projections of 20 μm thickness at 775 and 835 μm deep. The upper left section of each image shows the signal from 2C2P with pulses delayed τ=−600 fs, while the bottom right section shows the signal acquired with overlapped pulses, τ=0 fs. (c) Maximum intensity projection of five images over a 20 μm thickness taken with overlapped 2C2P excitation at a mean depth of 945 μm. The blue line denotes the region where a line profile is displayed in the lower panel. The signal to background ratio calculated from the line profile is 17. (d) Natural logarithm of the mean signal level versus depth. Scale bar, 100 μm.

