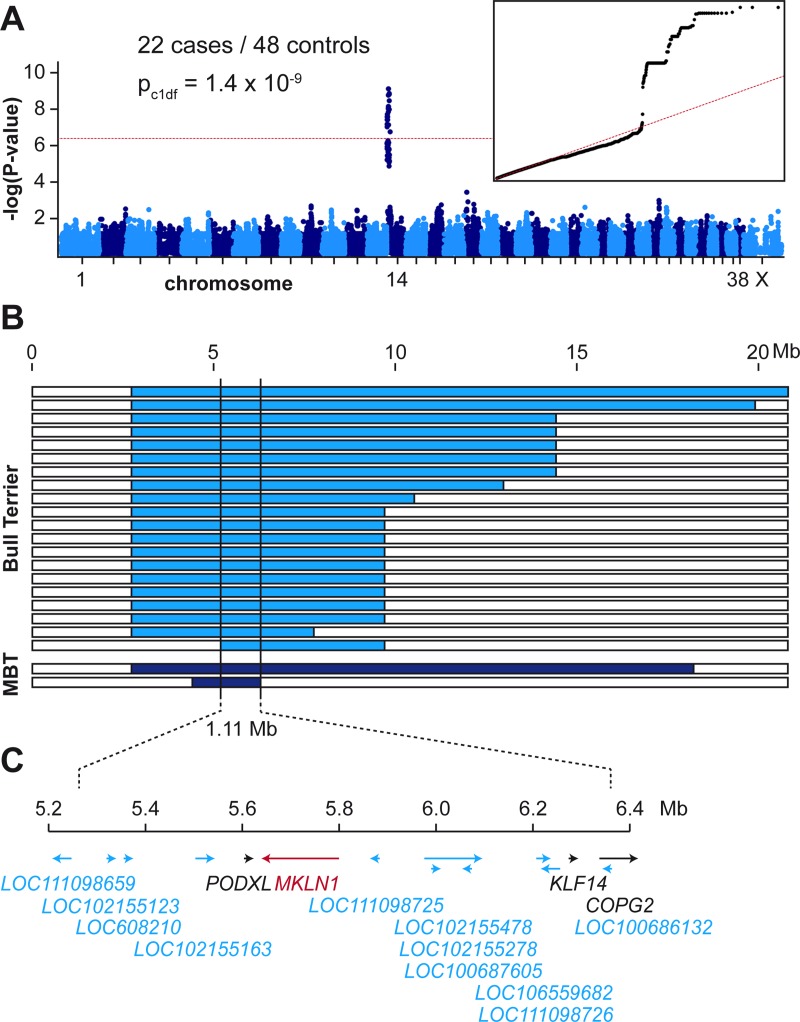
Fig 2. Mapping of the LAD locus.
(A) A GWAS was performed in a cohort of 22 LAD cases and 48 controls. The Manhattan plot shows a single significant signal at the beginning of chromosome 14. The red line indicates the Bonferroni significance threshold (PBonf = 6.5 x 10⁻⁷). The quantile-quantile (QQ) plot in the inset shows the observed versus expected–log(p) values. The straight red line in the QQ plot indicates the distribution of p-values under the null hypothesis. The deviation of p-values at the right side indicates that these markers are stronger associated with the trait than it would be expected by chance. (B) Haplotype analysis in the 22 LAD cases. Each horizontal bar represents the chromosome 14 haplotypes of one dog. Twenty Bull Terriers and two Miniature Bull Terriers (MBT) had large homozygous intervals with allele sharing on chromosome 14 indicated in blue. The homozygous haplotype segment shared between all 22 dogs spanned ~1.11 Mb. The critical interval for the causative LAD variant corresponded to the interval between the first flanking heterozygous markers on either side or chr14:5,248,244–6,355,383 (CanFam 3.1 assembly). (C) Gene annotation for the critical interval. The NCBI annotation release 105 listed 4 protein coding genes (indicated in black or red) and 11 genes for non-coding RNAs (indicated in blue).

