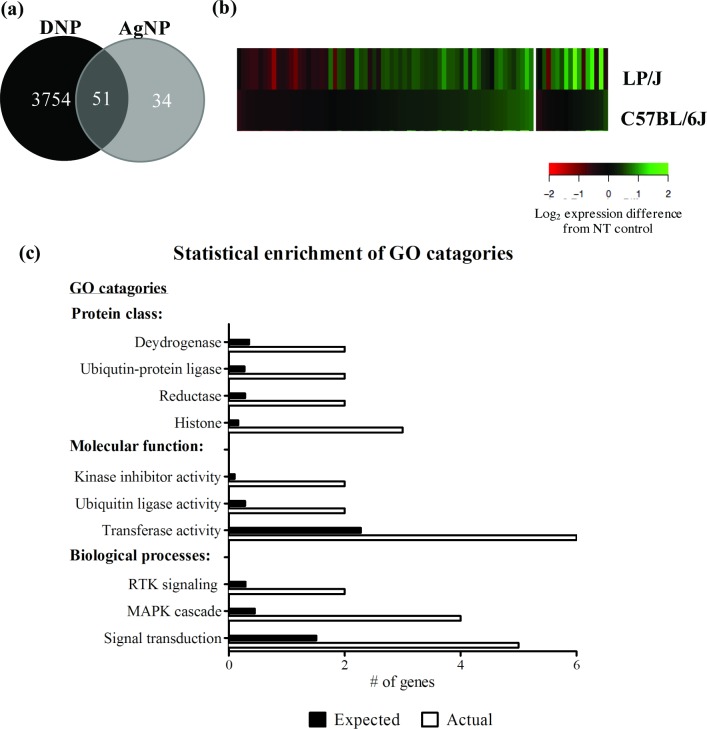
Fig 4. Quantitative comparison of differentially expressed transcripts and the biological responses that are significantly enriched in mast cells by AgNPs.
(A) Venn diagram showing the number of differentially expressed (DE) genes produced in response to DNP treatment (black) and AgNP treatment (grey) with a combined total of 3890 genes. (B) Heat map of the relative expression of 85 DE genes (FDR≤0.05) following AgNP exposure in the low responder (LP/J) and high responder strain (C57BL/6J). Expression patterns for individual genes are in rows. The color represents the direction of difference in expression with red indicating increased expression and green indicated decreased expression after treatment; The intensity of the color represents the magnitude of difference in expression (log2 scale) between AgNP treated cells and non-treated cells. (C) Gene ontology (GO) categories overrepresented in the 34 AgNP-responsive gene set were assessed using Pantherdb.org. GO categories are ranked by number of genes, listing the number of AgNP-responsive genes in each category (white bar) verses the number of genes expected in each category (black bar). Significance was set at p≤0.05 with a fold enrichment cutoff of ≥5. RTK, receptor tyrosine kinase; MAPK, mitogen-activated protein kinase.

