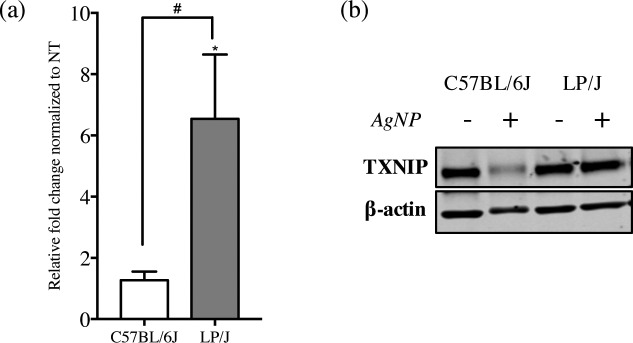
Fig 5. Expression of Txnip following AgNP treatment.
Bone marrow-derived mast cells (BMMCs) were treated with AgNP for 1 h at 25 μg/ml and A) mRNA expression of Txnip was quantified by real-time quantitative polymerase chain reaction (qPCR). Values are expressed as fold change compared to non-treated cells (n = 3/group) normalized to Gapdh. B) Representative immunoblots of TXNIP expression in both high (C57BL/6J) and low (LP/J) responder strains following AgNP treatment (1 h at 25 μg/ml). Values are expressed as mean ± SEM of at least 3 independent experiments. * Indicates significant difference from controlled group (p≤ 0.05). # Indicates significant difference between strains (p≤ 0.05).

