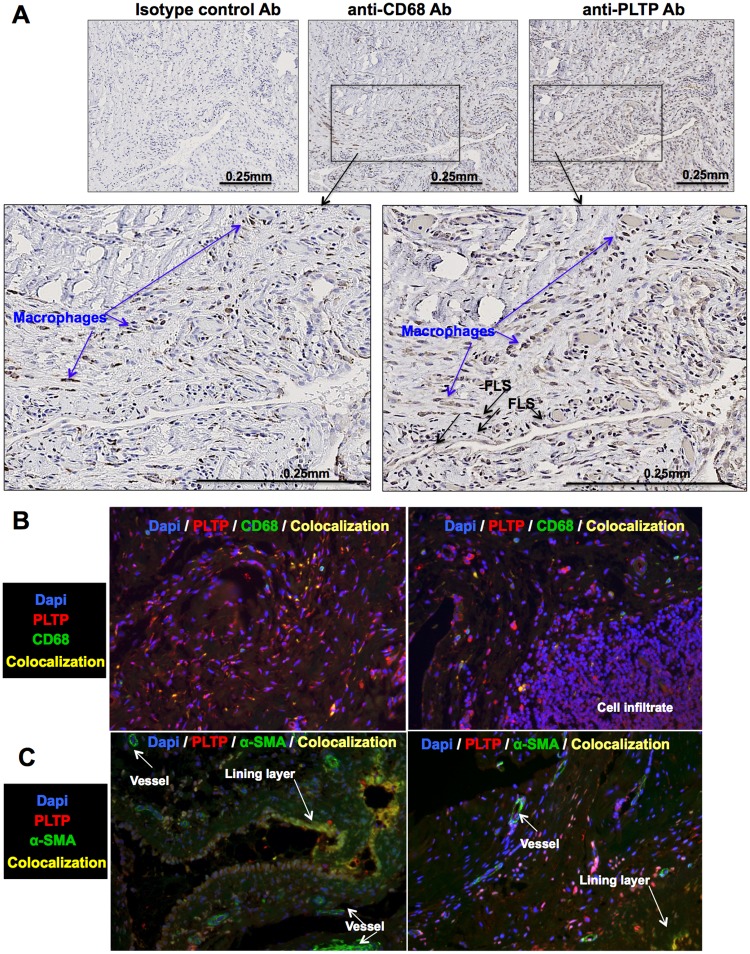
Fig 1. PLTP expression in RA synovial tissues.
For immuno-histological analysis, (A) synovial tissue sections from RA patients (n = 5) were stained for PLTP or macrophages (CD68+ cells). Representative images obtained for immunohistological staining are shown. Blue arrows show macrophages (non-exhaustive), determined as CD68+ cells. FLS are determined with morphological features and CD68+ staining (black arrow; non-exhaustive). (B, C) Double staining was performed to visualize localization (n = 3) of PLTP with macrophages (CD68+) (B) or RA-FLS (α-SMA+) (C). Fluorescence was analyzed at 20x magnification. Overlay is shown to visualize co-localization of PLTP in macrophages (CD68+) (B) or RA-FLS (α-SMA+) (C) or PLTP expression in infiltrate. Original magnification: 20x. Separate images can be found in S1 Fig.

