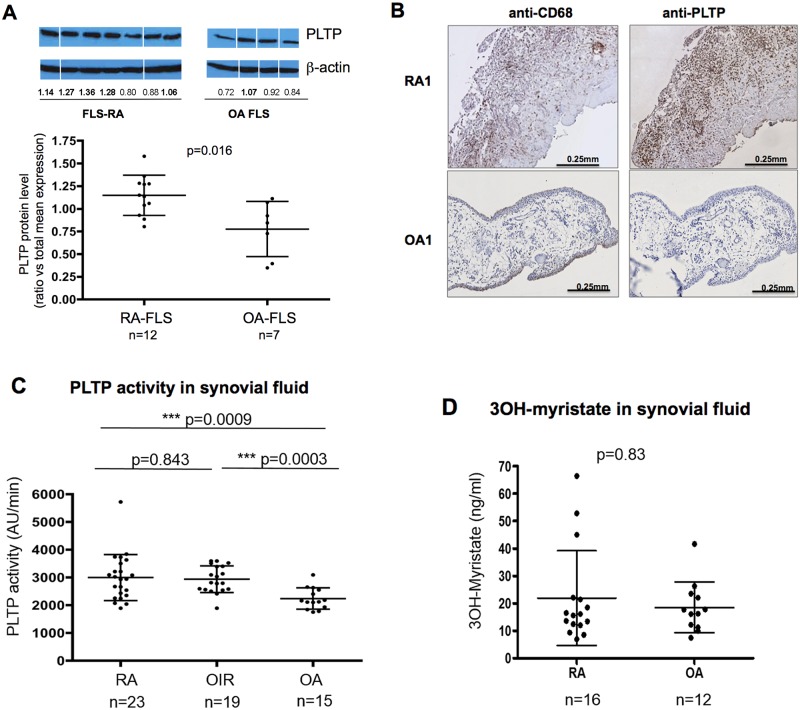
Fig 2. PLTP expression and activity in RA and OA joints and 3OH-myristate levels in synovial fluid of RA and OA patients.
(A) PLTP protein level in FLS was quantified by Western blot analysis, normalized using β-actin and then expressed as a ratio vs mean expression level in all FLS tested. Representative images obtained from one gel are shown. (Protein extracts were migrated stained and exposed at the same time. Original Western blot can be found in S2 Fig). All data are shown as mean ± SD and statistical analysis performed using Mann-Whitney test. (B) Immunohistological analysis of PLTP expression in synovial tissue from 5 RA and 6 OA patients stained for PLTP and macrophages (CD68+ cells); All RA synovial tissue showed positive stainings while only 2 out 6 OA tissues were positive for PLTP staining. Representative stainings are shown. (C) Phospholipid transfer activity was measured in synovial fluid by fluorescence as described in Materials and Methods. Data are expressed as mean increase in fluorescence per minute (AU /min) and represented as mean ± SD. Statistical analyses were performed using Mann-Whitney test (D) Net mass concentration of LPS was assessed in SF of RA patients (n = 16) compared with osteoarthritis patients (OA) (n = 12) by the direct quantitation of lipid A 3-hydroxymyristate by liquid chromatography–mass spectrometry (LC-MS analysis). Statistical analyses were performed using Mann-Whitney test.

