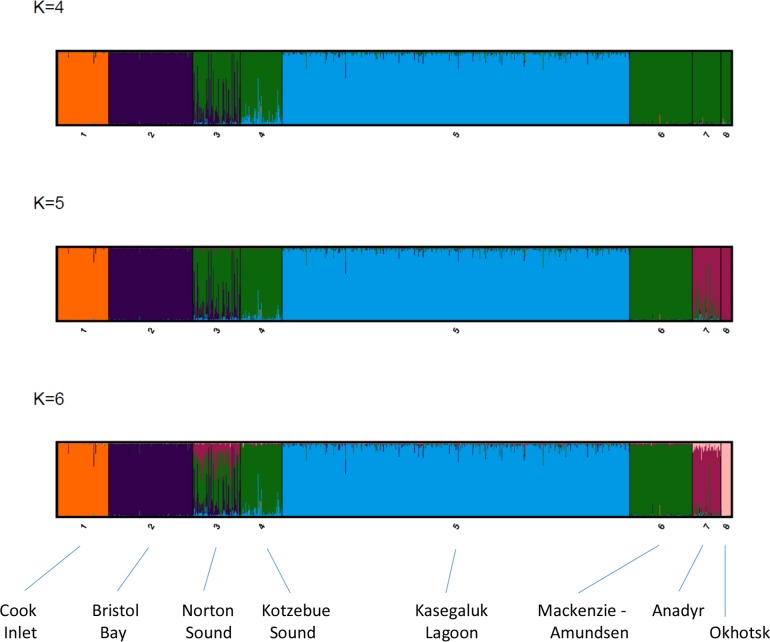
Fig 3. Summary plots generated in Clumpak of model-based cluster analysis of population structure in Pacific beluga whales using STRUCTURE 2.3.4.
The major modes for K = 4 to 6 (based on five separate runs for each value of K) are presented for the analysis using prior sample group information and no admixture which revealed K = 5 clusters as the most likely (see panel 2). However, in a number of analyses K = 6 was the most or second-most likely resulting in the separation of Anadyr into a discrete cluster (see panel 3). Each genotyped individual is represented by a vertical line with estimated membership, Q, in each cluster denoted by different colors. The analysis was based on using all individuals (n = 1032) scored at 6 or more loci (nloci≥6).

