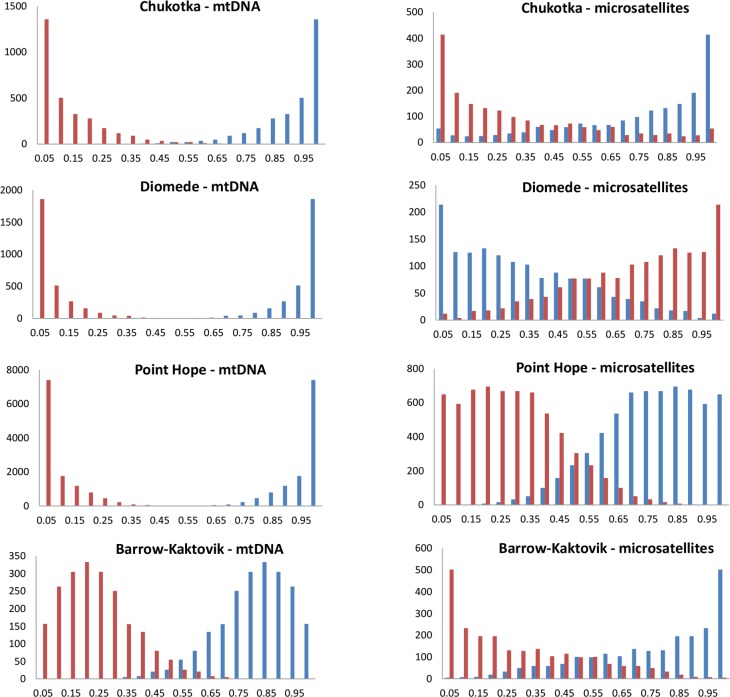
Fig 6. The probability distribution of population proportions of groups of beluga whales sampled on northbound migration in spring.
Stock-mixture analysis was conducted in Bayes with the eastern Beaufort Sea (blue) and the eastern Chukchi Sea (red) as baseline populations and the migrating groups as the potential ‘mixtures’. The ordinate axis indicates the number of runs.

