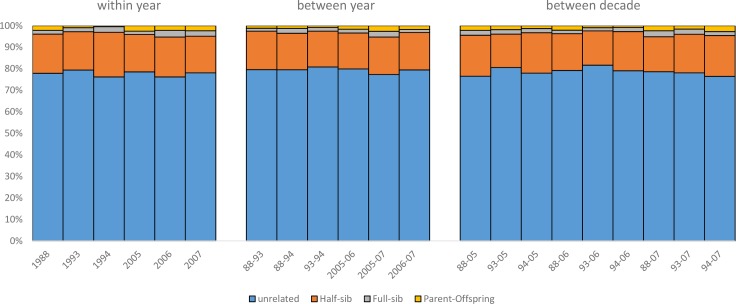
Fig 7. The proportion of pairwise genealogical relationships estimated for beluga whales sampled within and between years across two decades near Kasegaluk Lagoon, Alaska.
Maximum likelihood estimates of four relationship categories were estimated from genotypic data using the program ml-relate. The stacked bars represent the proportions of distantly/unrelated individuals to closely related individuals (i.e., parent-offspring, full-sib and half-sib or equivalent) for a subset of the 20-year data set comprising the first three years (1988, 1993, 1994) and the last three years (2005, 2006, 2007).

