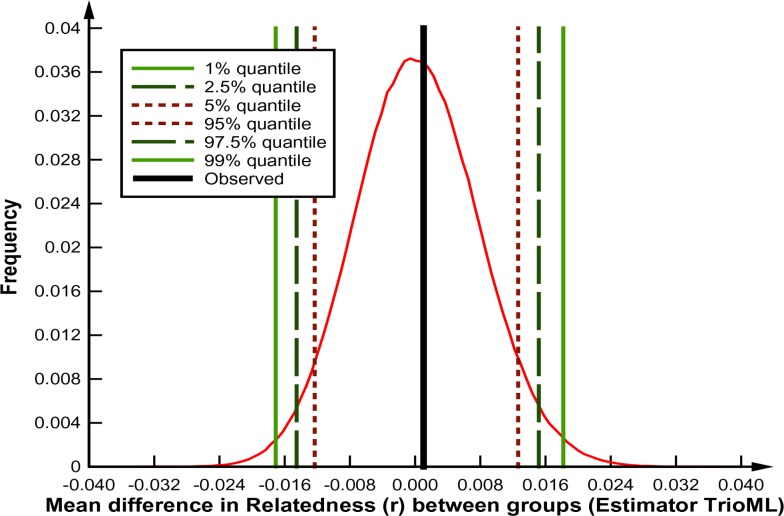
Fig 8. Test of differences in mean relatedness () among beluga whales within a single year compared to between whales from two different years for the same summering ground using coancestry.
The graph depicts results for Kasegaluk Lagoon 1988 compared to 1988–2007 using the ML estimator TrioML of Wang (2007). If the observed difference (black line) falls outside the 90% (dotted lines), 95% (dashed lines), and 99% (green solid lines) confidence intervals from the bootstrap analysis distribution the difference is adjudged to be significant.

