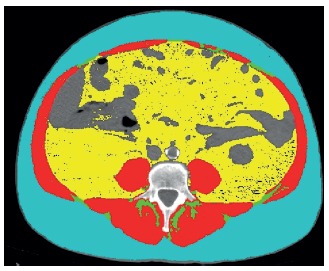
FIGURE 1. Image example of CT on l3 level axial plane, analyzed with sliceomatic®: the red color indicates the skeletal muscle; green indicates the intramuscular adipose tissue; yellow the visceral adipose tissue and the blue the subcutaneous adipose tissue.

