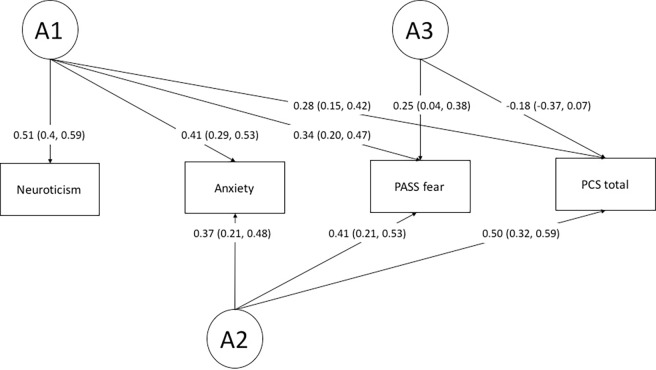
Fig 2. Path diagram of the best fitting AE Cholesky model depicting the sources of additive genetic variance and covariance (A1-A3) between neuroticism, anxiety sensitivity, fear of pain, and pain catastrophizing.
Standardized factor loadings with 95% confidence interval are displayed. Squaring the loadings and multiplying them by 100 results in the phenotypic variance explained by the specific additive genetic factor.

