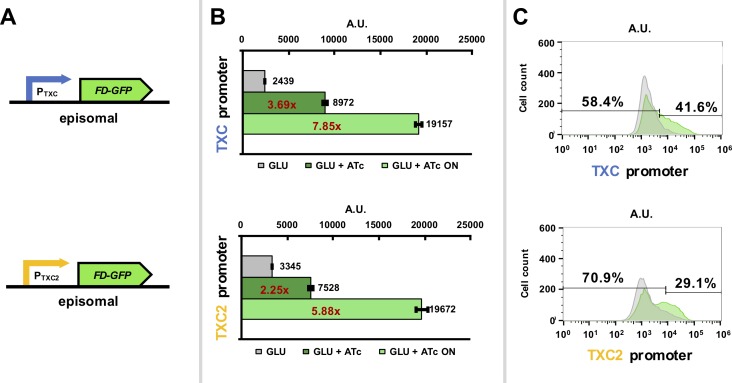
Fig 3. Characterization of hybrid promoter constructs expressed from 2-micron plasmids.
(A) Diagrams of the TXC and the TXC2 hybrid promoters driving FD-GFP expression. (B) Green fluorescence data from S. cerevisiae cells expressing the pGPY055 (TXC hybrid promoter) and pGPY054 (TXC2 hybrid promoter) integrated constructs in synthetic complete glucose media after induction with 200 ng/μl anhydrous tetracycline (ATc) for 5 hours. Uninduced samples where no ATc was added were also included. Data show average mean fluorescence values of biological triplicates as determined by flow cytometry. Mean fluorescence values of the “ON” cell populations (cells that are considered to fluoresce), which are determined by the 98th percentile of the uninduced samples, are also shown. The ratios between induced and uninduced cells are shown in red. (C) Histograms of fluorescence intensity over cell count of one of the triplicates of each strain to showcase potential bimodality. The gates that separate the “ON” and “OFF” populations for each sample are also shown along with percentages.

