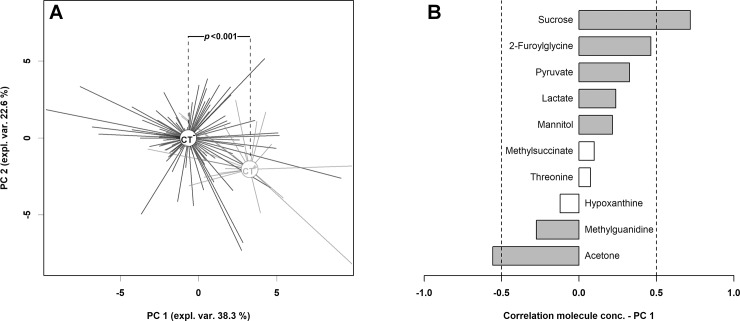
Fig 2. rPCA model calculated on the space constituted by the concentration of the molecules listed in Table 1.
In the scoreplot (A), CT-negative (CT-) and CT-positive (CT+) subjects are represented in black and gray respectively, with lines connecting each subject to the median of its group. In the barplot (B), describing the correlation between the concentration of each molecule and its importance over PC 1, dark gray bars highlight statistically significant correlations (P<0.05).

