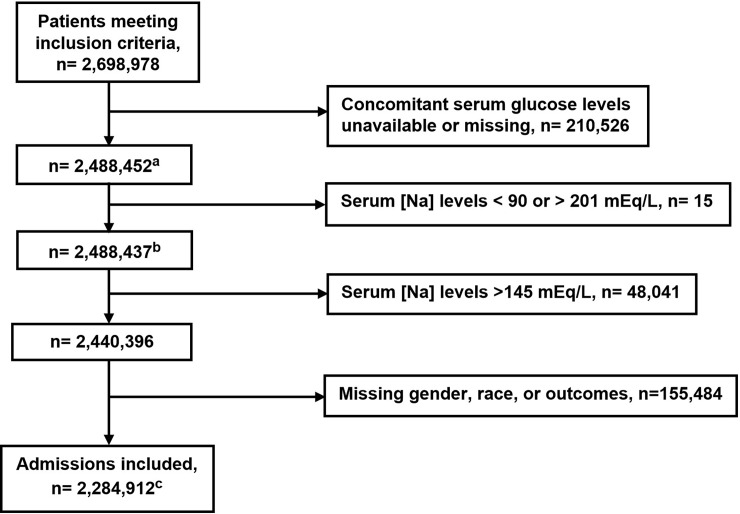
Fig 1. Flow chart of the sample selection process.
aSerum sodium levels were corrected by adding 1.6 mEq/L for each 100 mg/dL above 100 mg/dL of the concomitantly measured serum glucose levels. bThis number was used to calculate the prevalence of hyponatremia (Na < 135 mEq/L) at hospital admission. cThe final cohort available for analysis.

