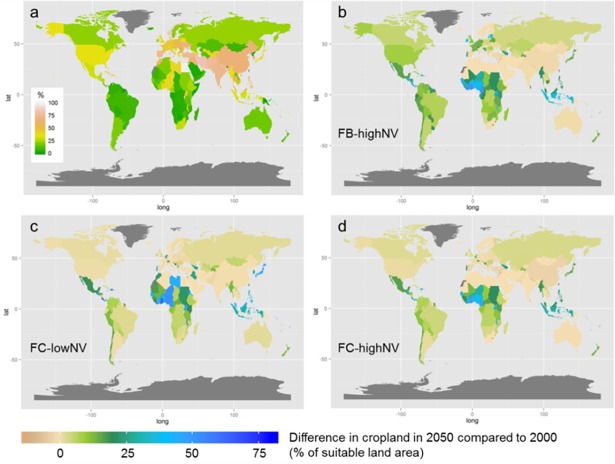
Fig 5. Global cropland area changes over time for the three focal scenarios.
(A) Per country cropland area as a percentage of suitable land (moderate to very high suitability from the Global Agro-ecological Zone Data Portal; (FAO/IIASA, 2011). Changes in cropland area in 2050 compared to 2000 (% of suitable land) for (B) FB-highNV, (C) FC-lowNV and (D) FC-highNV. Countries displayed in grey are excluded from the analysis due to missing input data.

