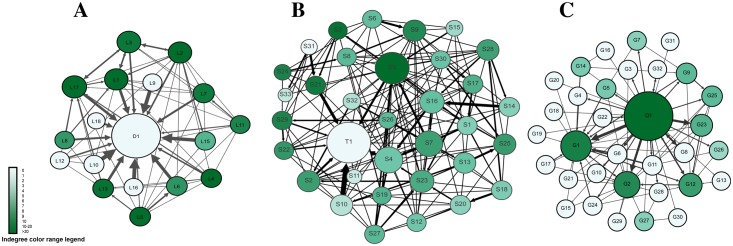
Fig 4. Visualization of all interactions in the three courses post intervention.
Each circle (node) corresponds to a participant. Node size is proportional to the degree centrality (sum of incoming and outgoing interactions). Arrows between nodes represent interactions, and the thickness of the arrows represents frequency of interactions. The arrow heads represent the target of interaction. The color range corresponds to betweenness centrality.

