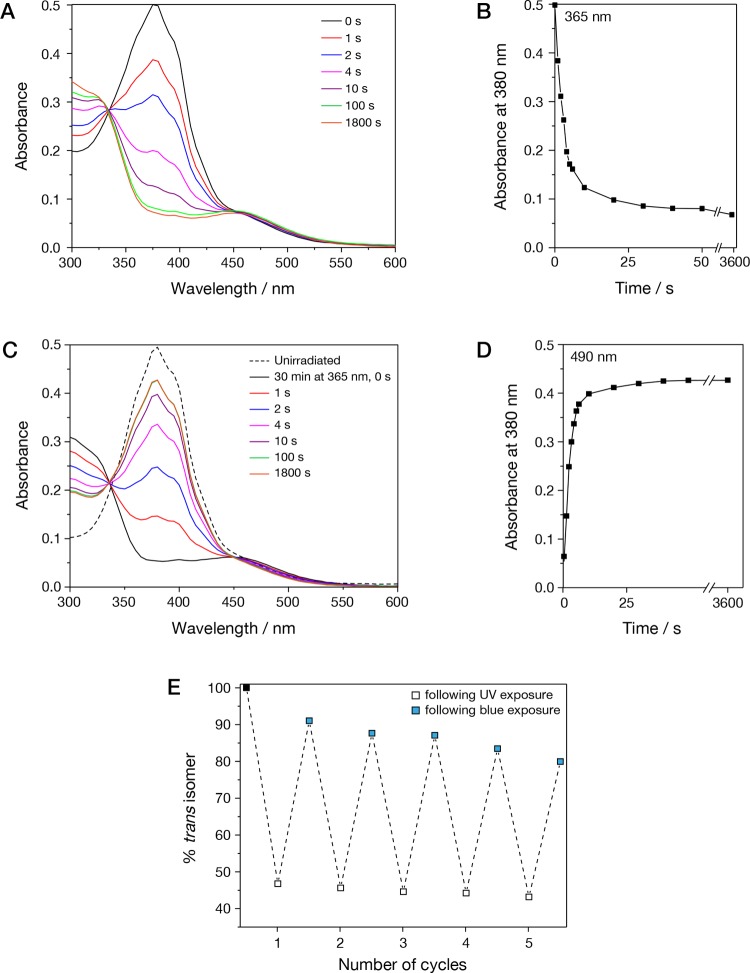
Figure 2.
UV–vis absorbance spectra of AZO. (A) Sequential absorbance spectra after exposure to 365 nm irradiation for varying amounts of time. (B) Plot of absorbance at the AZO λmax (380 nm) against length of time under 365 nm irradiation. (C) Sequential absorbance spectra after exposure to 365 nm irradiation for 30 min, followed by 490 nm for varying amounts of time. (D) Plot of absorbance at the AZO λmax (380 nm) against length of time under 490 nm irradiation, showing the degree of reversibility in photoisomerization. (E) Graph of % trans isomer after each photoswitching cycle for AZO (30 min at 365 nm, followed by 60 min at 490 nm).

