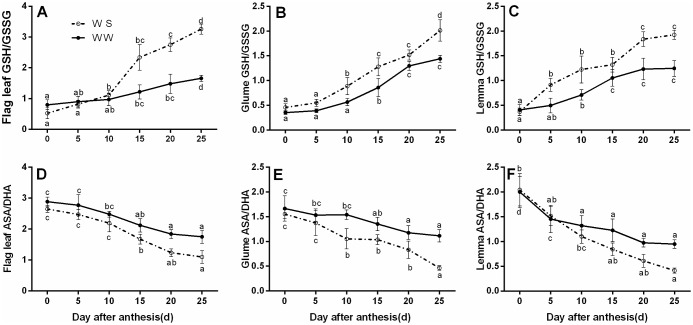
Fig 3. Effects of drought stress on the ratios of GSH/GSSG (A, B, and C) and ASA/DHA (D, E, and F) of the flag leaves, glumes, and lemmas at the grain-filling stage under well-watered (WW) and water-stressed (WS) conditions.
All data represent means ± standard deviations (SD) of three replicates. Values with different letters indicated the significant differences at P < 0.05 level in each stress treatment through time according to Duncan’s multiple range test.

