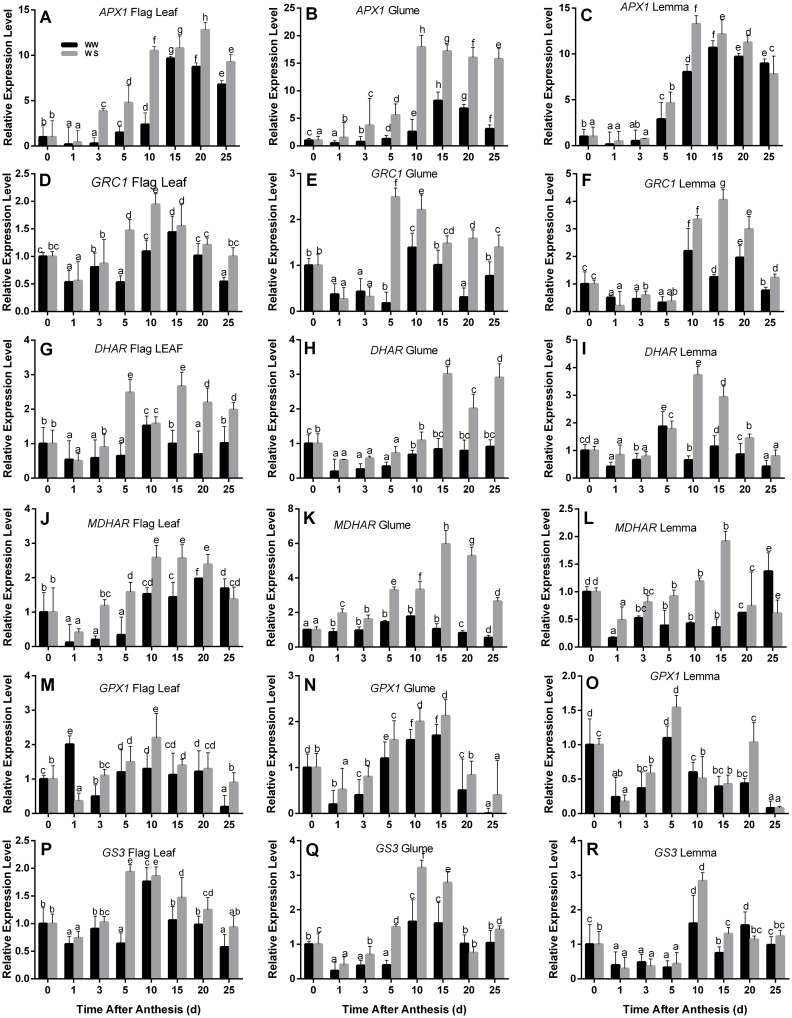
Fig 5. Effects of drought on transcript levels of six genes encoding ASA-GSH cycle enzymes in the flag leaves, glumes, and lemmas of wheat at the grain-filling stage under well-watered (WW) and water-stressed (WS) conditions.
Transcripts were analyzed by qRT-PCR using Tubulin gene as internal control. Each value is the mean ± standard deviation of three independent measurements. Values with different letters indicated the significant differences at P < 0.05 level in each stress treatment through time according to Duncan’s multiple range test.

