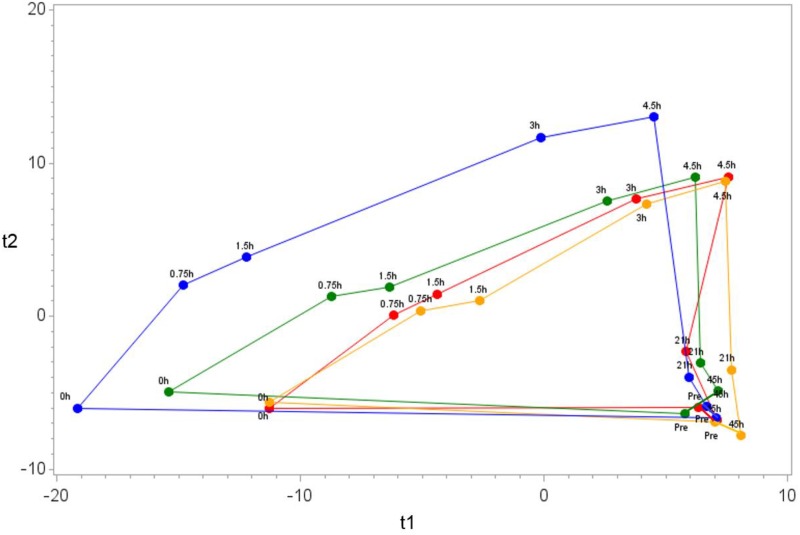
Fig 7. OPLS-DA and the overall pattern in the data.
The centroid was calculated for the samples in each treatment and time point combination. Water trial is in blue; 6% sugar beverage trial is in red; Cavendish bananas trial is in green; Mini-yellow banana trial is in yellow. This analysis passed permutation based validation, which indicates that the observed pattern did not occur by chance. However, the low Q2Y score (0.049) indicates poor prediction ability, especially for the time points that have similar metabolomics profiles, such as pre-exercise, 21-h and 45-h post-exercise. It is not a concern in this analysis, because complete separations of all of the treatment and time point combinations were not expected. The goal of this analysis was to examine the overall pattern in the data.

